AI-native site investigation for geotechnical teams.
One place for your whole investigation.
Proposals, schedules and site plans in one place, so the field, the office and your client are always looking at the same thing. Image the whole borehole with nothing but your phone. Strataworks writes the updates, reads the documents and runs the checks, so the hours you spend on coordination go back to the technical work.
For anyone running geological site investigations. ASTM and AGS compliant.
- In pilot on live site investigations in the US
- Built by geologists with years of field experience
- Works with no internet
- AGS4, gINT, OpenGround, PDF, XLSX, DXF
01The problem
Drilling is the most expensive week of the job and the least visible.
- 01
The same data lives in eight different places
Written on paper notes, typed again into a database, checked again against the run photos. Plenty of chances to be wrong, and everything downstream is affected.
- 02
The decision gets made before the data lands
The hole is backfilled and the rig is on the next pad while the log is still being typed up. The decision gets made on an assumption, and if the ground disagrees, it disagrees on site.
- 03
Coordination is eating your week
Your most expensive log reviewers spend their time on formatting changes, chasing photographs and reconciling spreadsheets. None of it is engineering, all of it is your hours, and it scales with every project you take on.
02Why firms buy it
Value for the office and the field.
A centralized source for your proposal
Build the site plan in the same place you write the RFQ, with the schedule and the holes beside it. No spreadsheet, no PDF, and no two-week wait on the GIS team. When the contractor moves a hole, and they always do, you make the edit in real time with no downstream impact.
Run more projects
Project tracking stops being a phone call, and the client can see it directly on a dashboard. The constraint on how many investigations you can carry was never the drilling. It was how much of your attention each one needed, and less time spent on communication is more time on the technical work.
Know which project is going sideways, this week
Footage against plan on every job, and boreholes appearing as they are drilled. With daily field reports, the issues encountered can be easily explained and the necessary actions taken.
03In the office
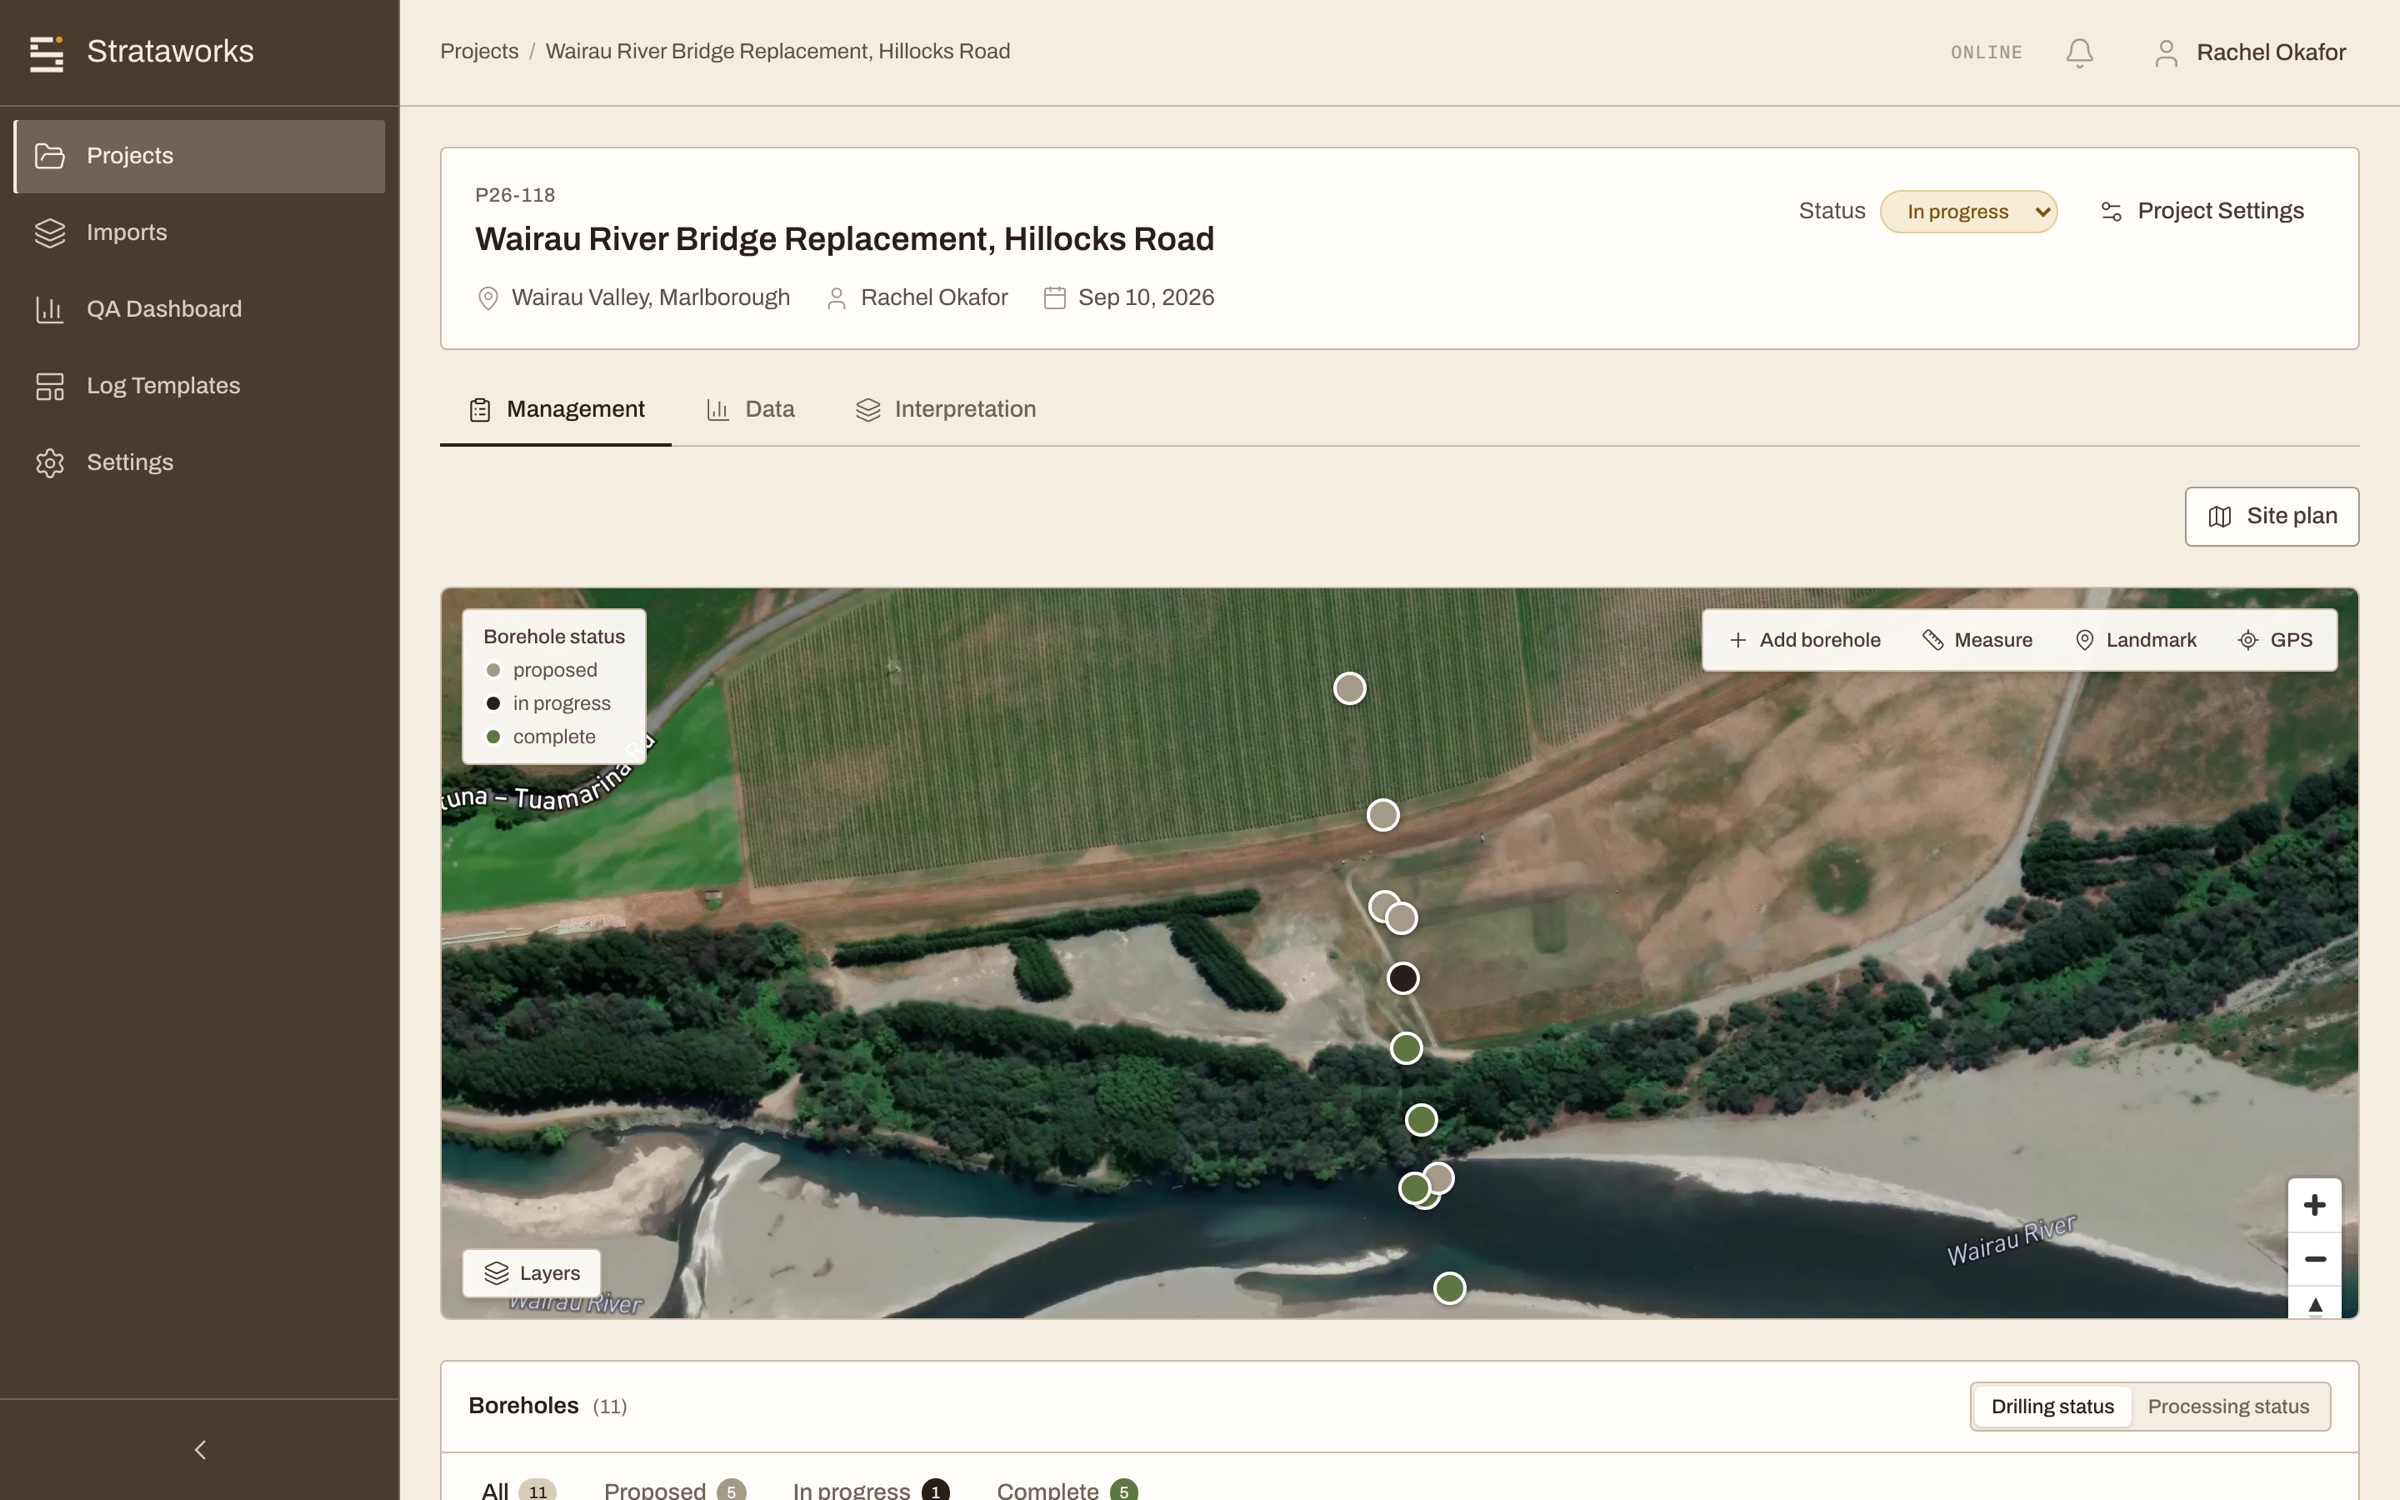
The status of every drill rig, current this morning.
Until now you spent hours a day on the phone with your field geologist, helping them make decisions off a description.
Footage against plan, data as the holes are drilled, logs drafted and waiting for review, and the sample imagery itself, so a senior can review against the sample rather than take the description on faith.
- Every project, one list
- Footage, hole count, review queue and last activity across all active projects, without opening any of them.
- Boreholes as they are drilled
- Collars land on the site map with status, so the plan and the reality are the same picture.
- Footage against schedule
- How much was drilled, against what the plan said.
- Crews, rigs and equipment
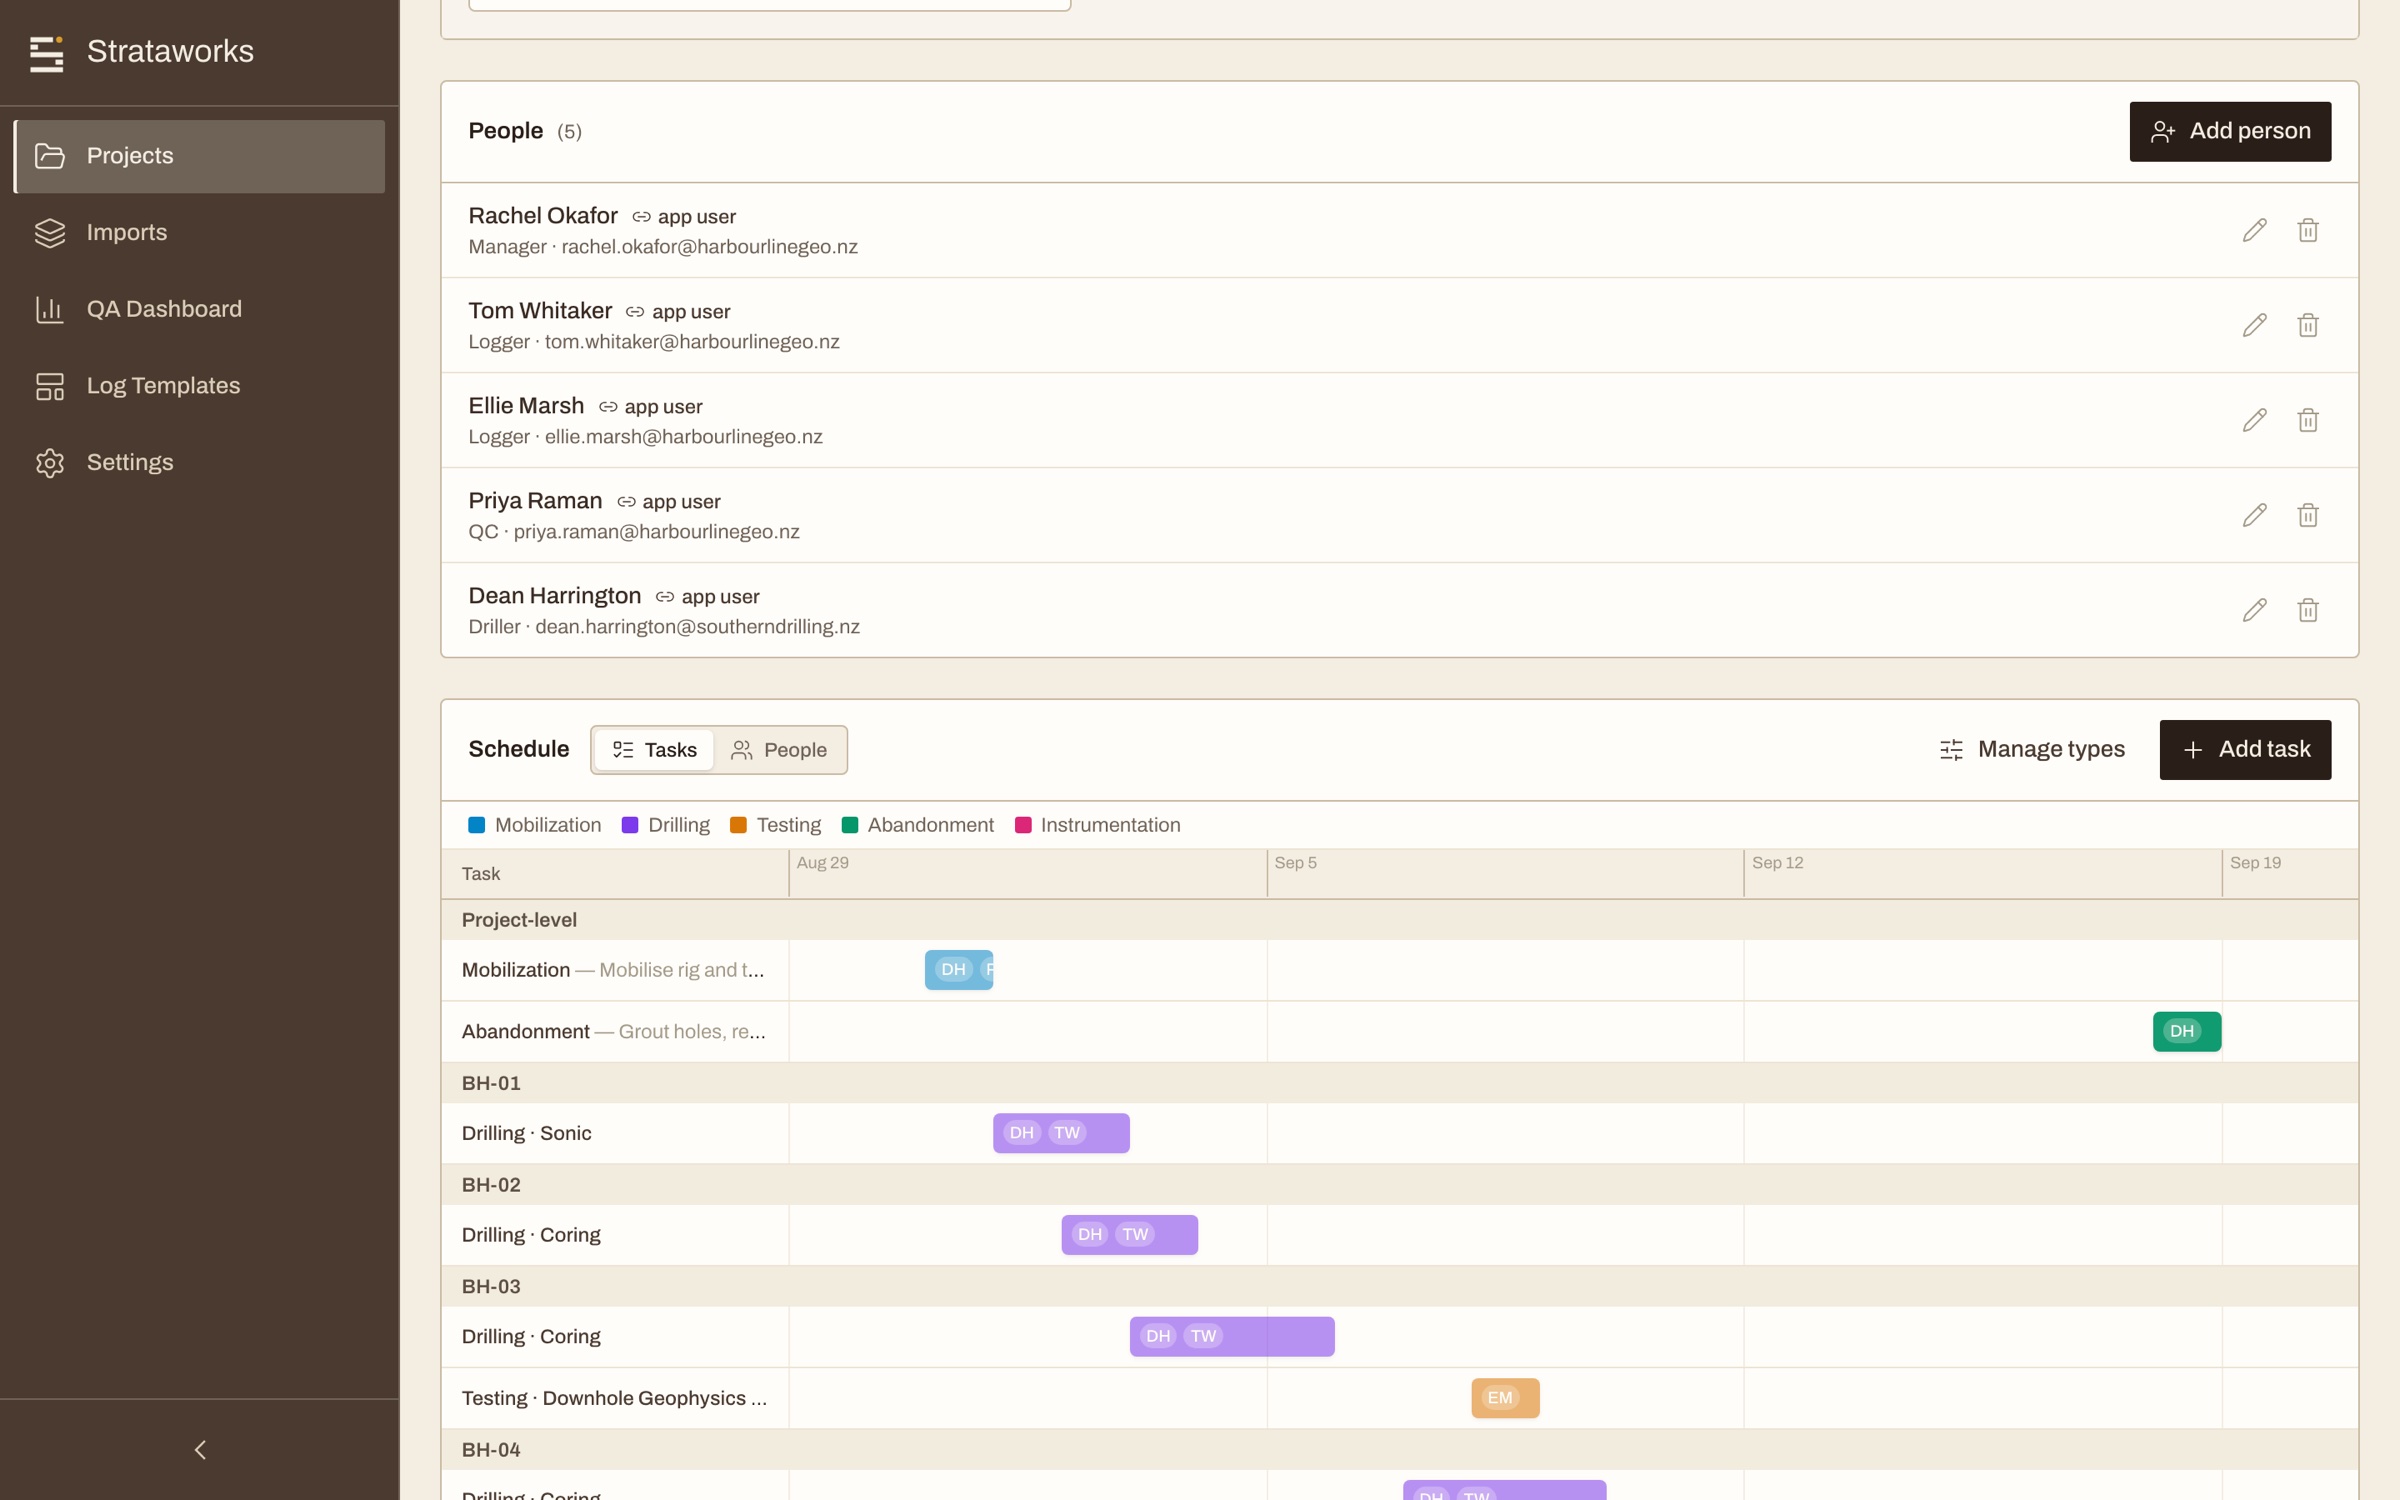
- Mobilisation, drilling, testing and abandonment scheduled per borehole, so the people and the plant are where the plan says they are.
- The samples, beside the data
- The scanned samples sit next to the log and the data in the browser, on the same depth axis.
- The field diary, already written
- Site notes, crew, conditions and end-of-day depths, captured on site rather than reconstructed later.
04What runs on its own
The half of your week that isn't engineering.
Coordination is not the job, but it is where the week goes. Strataworks orchestrates it: the crews, rigs and equipment against the schedule, and the menial parts around them — writing the updates, reading the documents, reconciling the plan and running the cross-checks nobody has time for. What comes back is a well-constructed draft, ready for your review.
Updates, already written
End of shift on every active hole, summarized into something you can read in a minute or forward as-is. Crew, conditions, footage turned, what changed. You edit it before it goes anywhere.
Documents, already read
Scanned PDF borings, legacy logs and incoming project documents read into structured rows, with a confidence score on every field and a review queue for the ones that need a look.
Checks, already run
Field descriptions against lab results, depth gaps and overlaps, recovery and RQD against the density you described, USCS symbols against plasticity and grain size. Continuously, sorted by how much it matters, rather than the week before the report is due.
AI does the paperwork. You focus on the technical questions.
05In the field
How the data gets there.
The tedious part of logging is already done by the time the scan finishes. The phone sweeps the tray, stitches the frames into one continuous image, marks the obvious discontinuities and drafts the lithology changes, RQD and recovered length. Your geologist reviews, adds to it and improves it into the final product.

1.482 m
21.8 m22.3 m22.8 m23.3 m- 01Confirm
- 02Measure
- 03Sweep
- 04Stitch
- 05Register
- 06Draft
- 07Review
- 01
Confirm
One tap on the interval to start logging.
- 02
Measure
Three taps set world-locked rails. The second is the end of the interval to scan, so the length is measured off the world instead of read off a tape.
- 03
Sweep
Pose-stamped frames at a steady cadence, exposure locked at the first row so the tray does not shift tone halfway down.
- 04
Stitch
The frames become one continuous image of the tray, assembled on the phone.
- 05
Register
Depth labels are read off the image and anchor it to true downhole depth.
- 06
Draft
Natural breaks are marked and intervals proposed. RQD, recovery and fracture frequency follow from them.
- 07
Review
Your geologist adds to and checks the automatically logged features, with the samples still in front of them.
Every suggestion lands in a row your geologist can edit or reject, and an unreviewed suggestion is excluded until someone accepts it.
The checks run while the sample is still with the geologist.
Strataworks grades its own capture the moment it finishes stitching, so a weak section or a run assembled in the wrong order surfaces immediately. Every other tool tells you the photograph was no good after the box is closed and the rig is on another site.
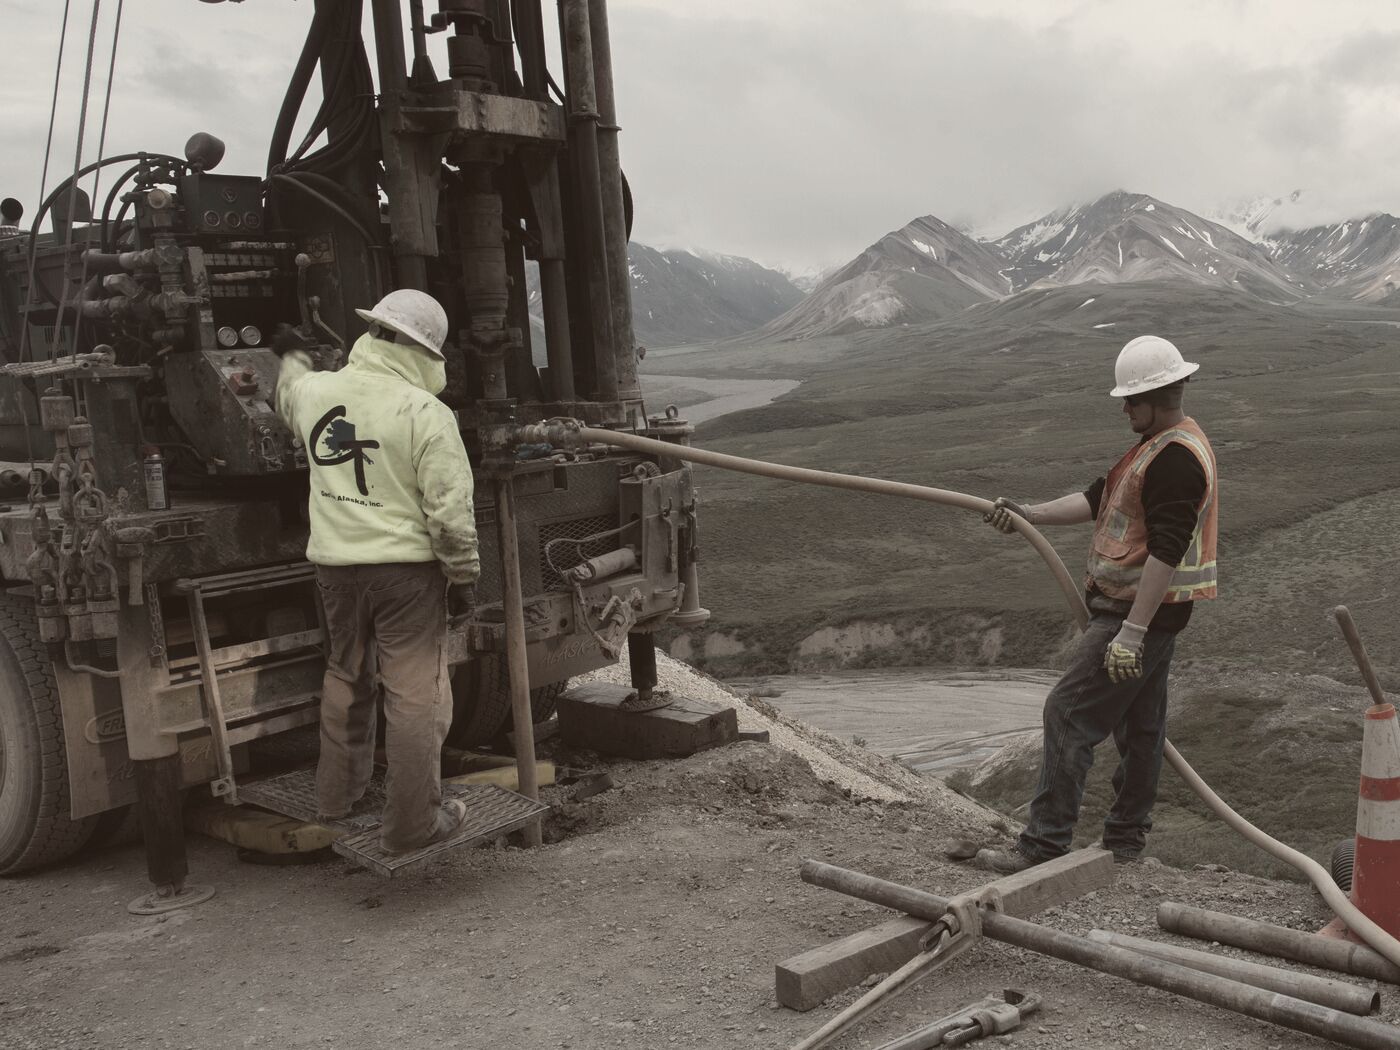
Field · Drilling on site
A geotechnical investigation on the Denali Park Road, where the ground under the road is the question.
06Interpretation
The ground model can start immediately.
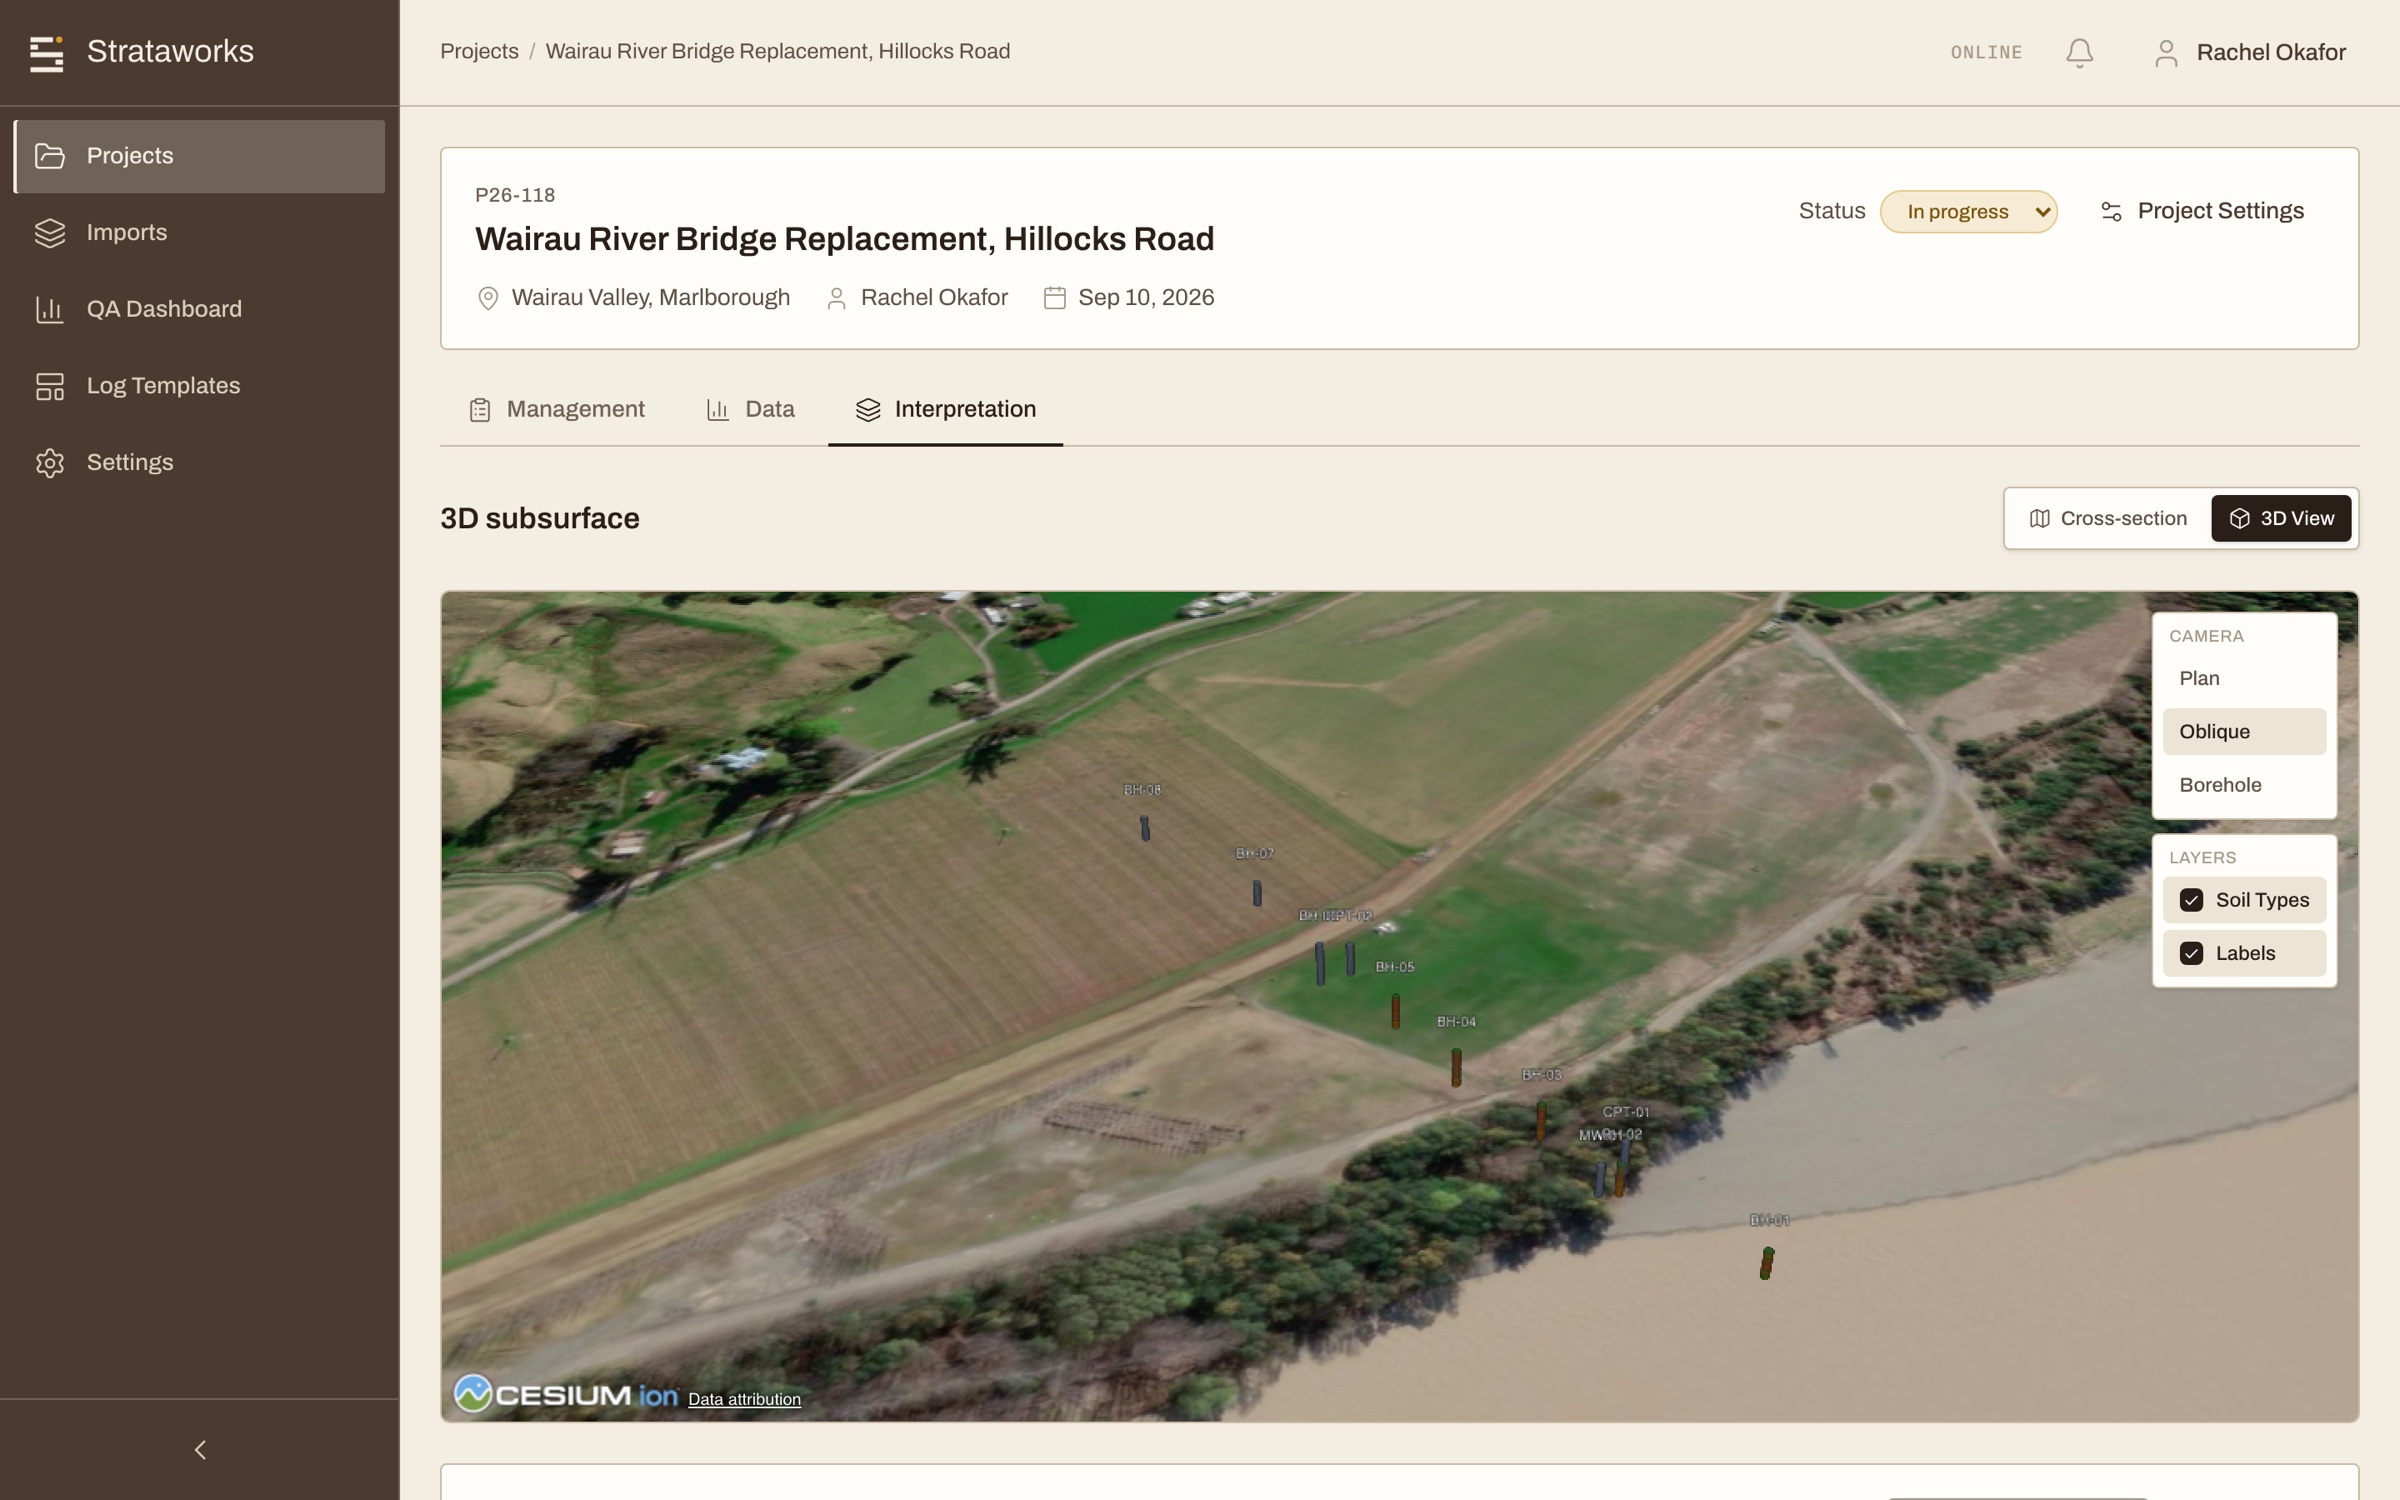
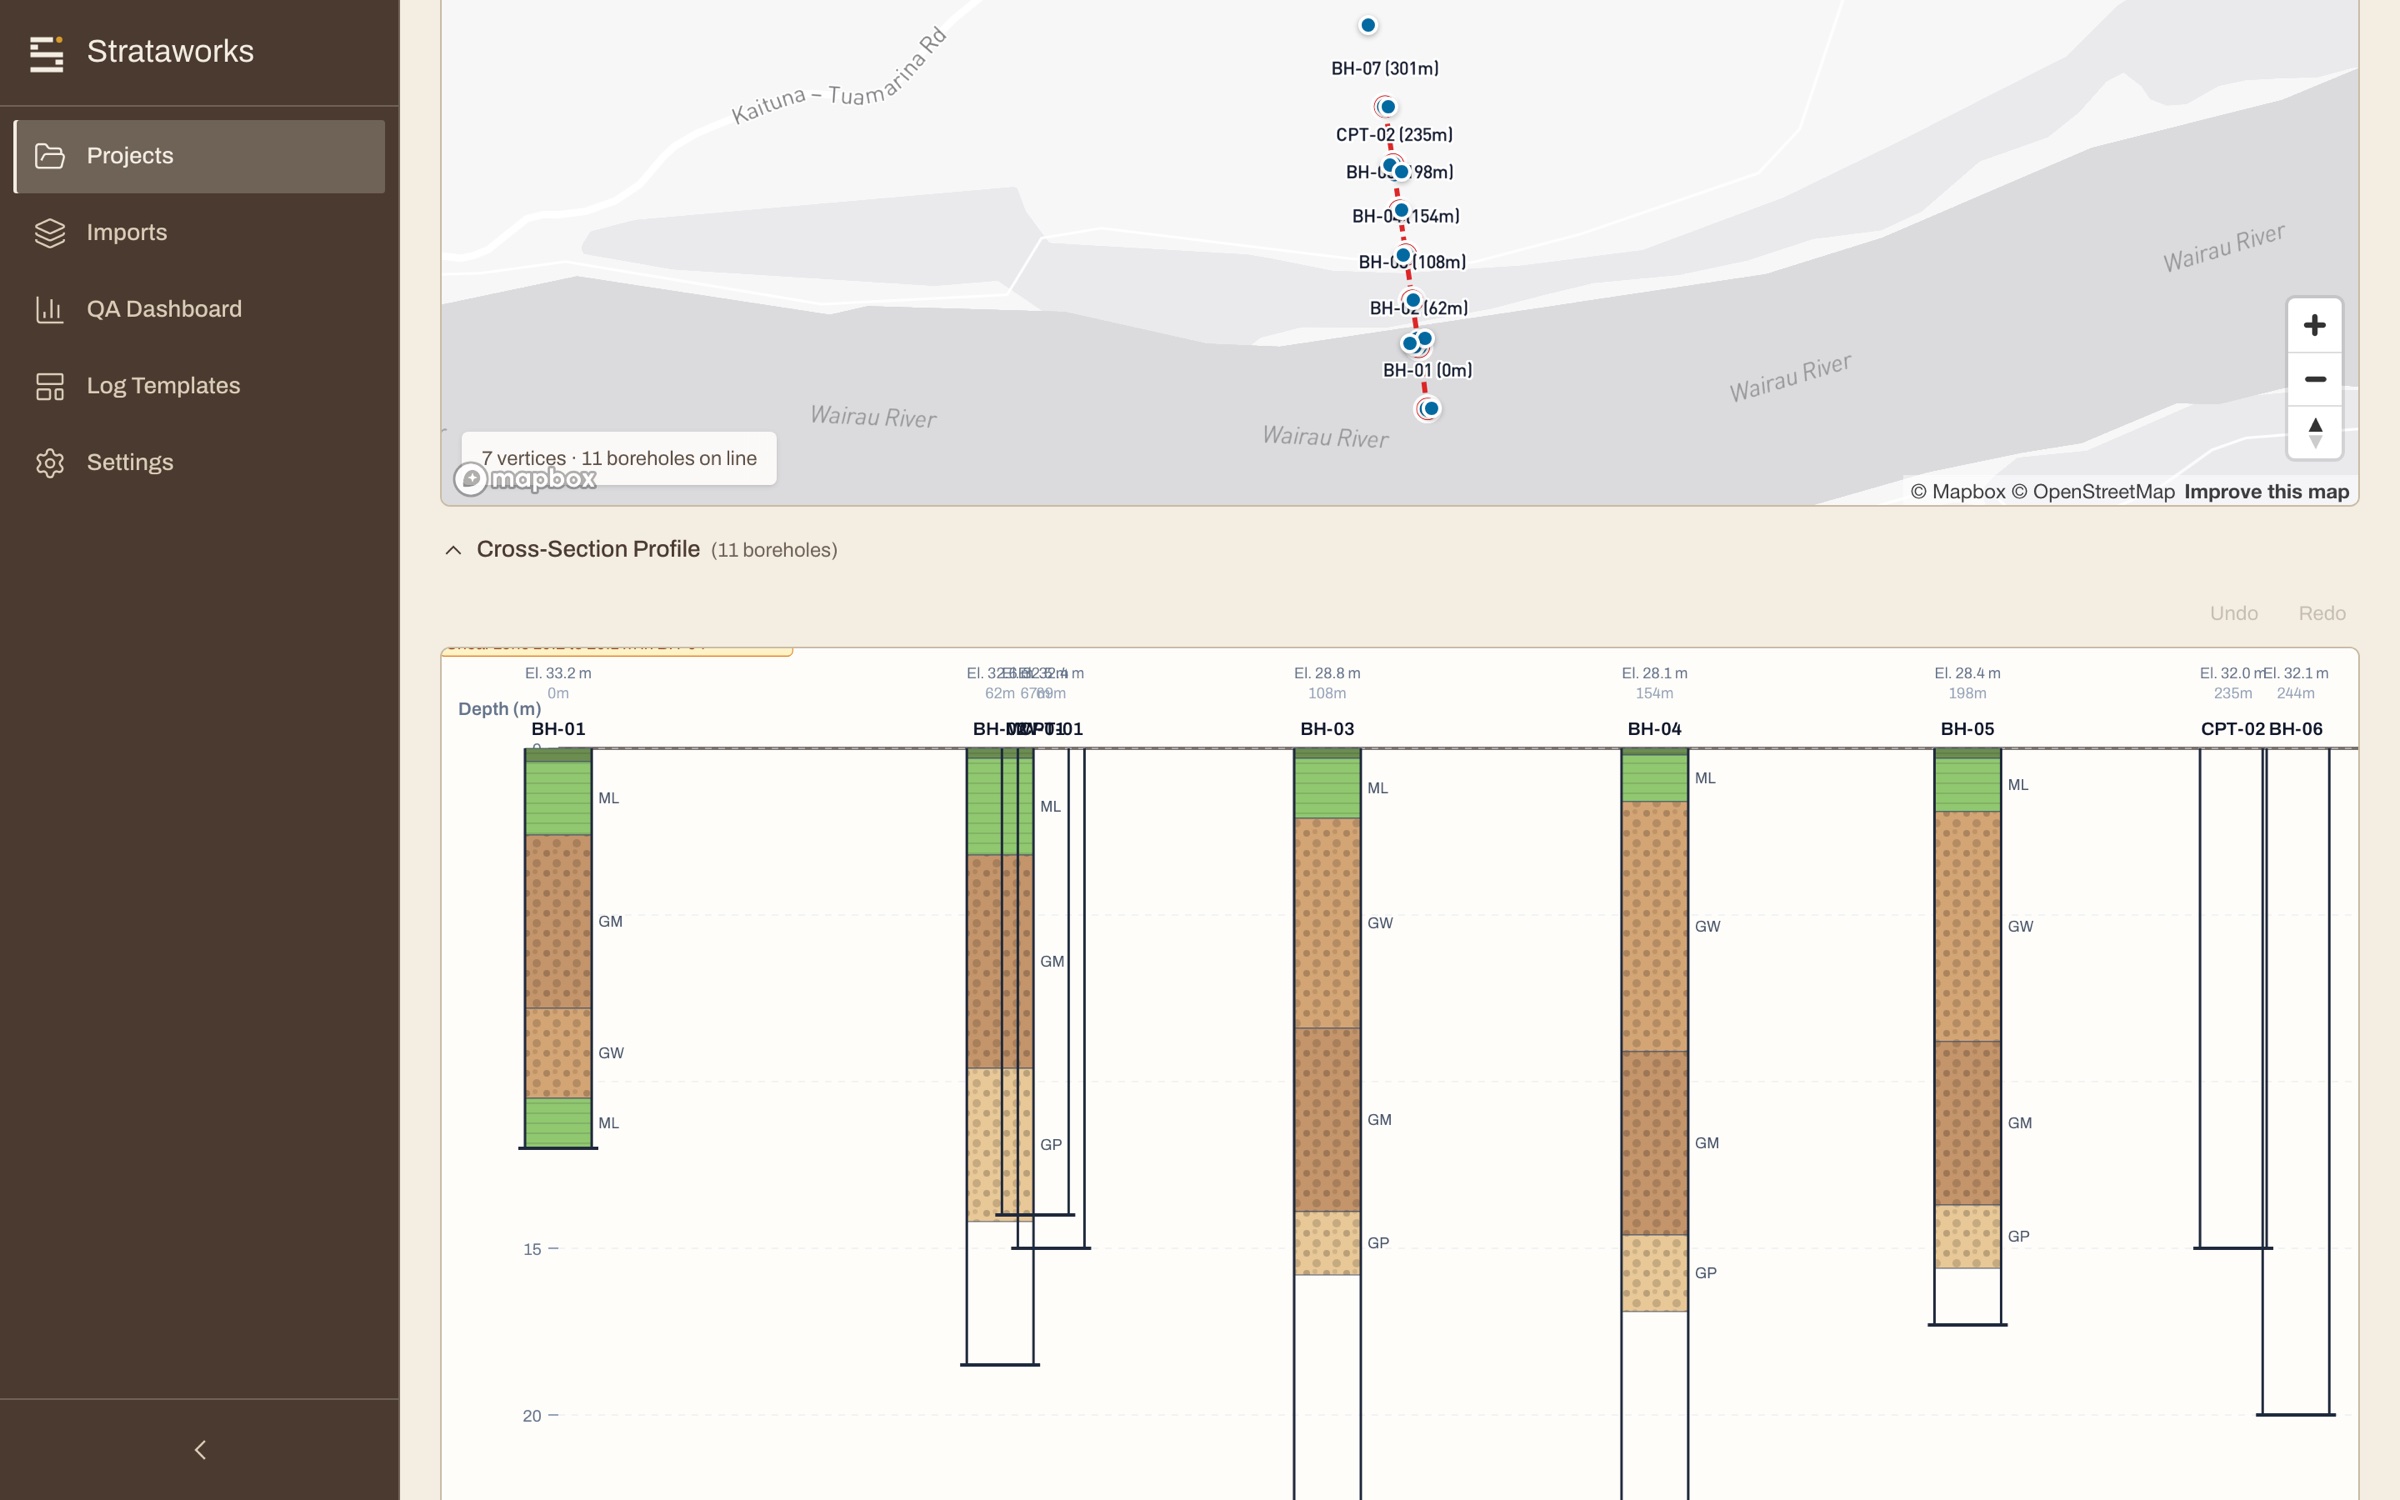
Every logged interval is already a coloured band on a borehole in 3D, sitting under the terrain on the satellite imagery, with the site's real coordinates and elevations. Draw a section line across the holes and the same intervals become a cross-section, with formation tops to correlate and annotations for the designer.
07In review
What the checks actually look at.
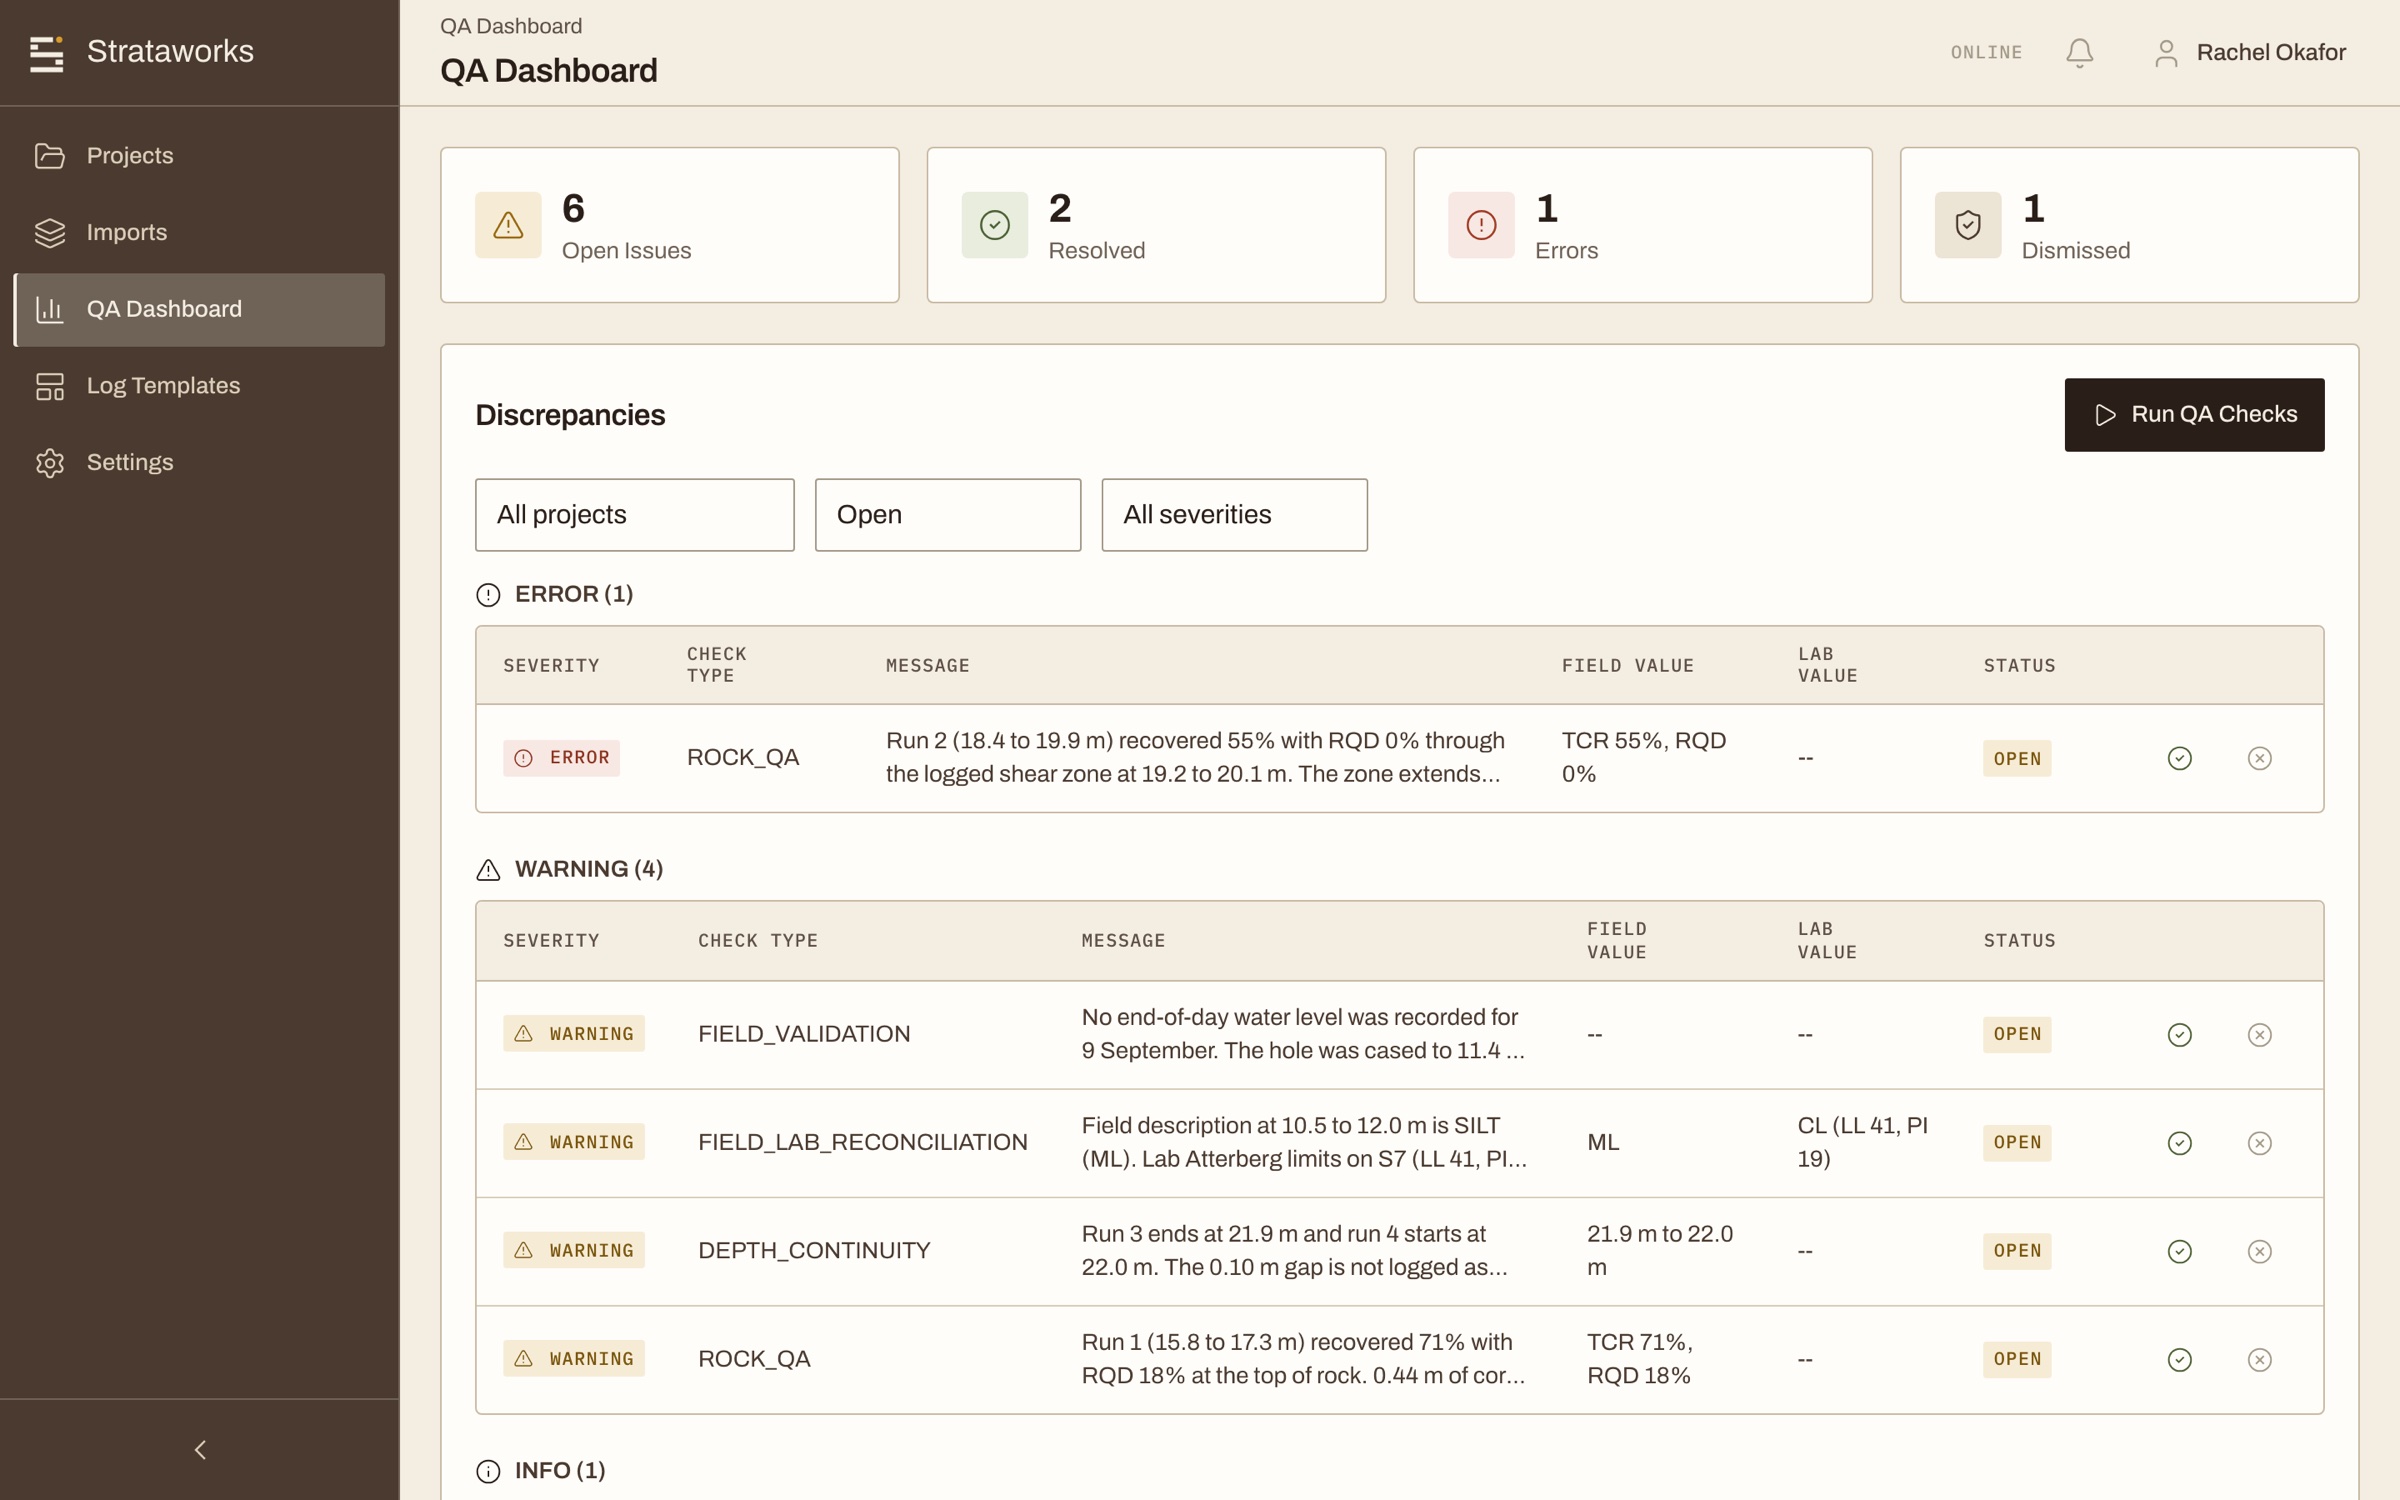
Formatting, consistency, presentation. These are what hold up your report on its way out the door. Strataworks automates them so you can focus on what is important: getting the geology right.
Every check is a suggestion with a name on it. AI is here to assist us geologists in making a better product. A human always has the last say.
Field against lab
Descriptions reconciled against the lab results when they come back, with the disagreements listed by depth.
Depth continuity
Gaps, overlaps and sample numbering, caught as you log rather than found in review.
SPT, recovery and RQD
Blow counts and recovery cross-checked against the density and hardness you described. RQD checked against the logged discontinuities.
Classification
USCS symbols checked against the plasticity, grain size and moisture in the same description.
08In and out
Your data, your way.
Use the standards you and your clients are used to.
ASTM D2487 and D2488 with USCS symbols, or AGS4 for the firms that use it. gINT projects in, OpenGround out. Feet or metres, set per project. You pick the coordinate system and everything projects to it.
Everything is stored in metres and converted at the point of display, so a project set to feet and a project set to metres are the same numbers underneath.
In
Bring what you already have.
gINT .gpj projects, spreadsheets with a column-mapping step, and scanned PDF borings read by the digitiser. Everything lands in a review queue first. Nothing enters a project unchecked.
Out
Leave in what they asked for.
Your own log template rendered to PDF. AGS4 for modelling and analysis. XLSX with a sheet per table per borehole. DXF, KML, GeoJSON and Leapfrog CSV for GIS, CAD and modellers. You pick the coordinate system and everything projects to it.
Alongside
Keep your database of record.
If OpenGround is where your data lives, it stays where your data lives. Strataworks pushes validated boreholes across with configurable field mapping, and the sync view shows what is pending, synced or failed. You are adding a capture layer, not replacing a system.
- OpenGround Cloud
- AGS4
- ArcGIS
- Civil 3D
- Leapfrog
- Google Earth
- gINT
- CSV / Excel
09Trust
Your data stays yours.
Site investigation data is commercially sensitive, and it outlives the project it was collected for. Strataworks is built so that the record of who logged what, and when, lasts as long as the data does.
Every sample is photographed, measured, registered to depth, timestamped and audit-logged. Three years from now you can show exactly what was seen, when, and by whom.
It is built by geologists who have done site investigations for a living. The product is shaped by real-world drilling and site experience, not by software engineering theory.
Federal, DOT or public-sector work? Ask how Strataworks lines up on your requirements.
- Every query is scoped to your organisation, enforced in the database rather than the interface
- Every change is recorded, with who made it, when, and what it replaced
- Seven roles, from driller to reviewer, with permissions checked server side on every request
- Encrypted in transit and at rest
- Your project data is never used to train models
- Deleting is recoverable, and retention is bounded rather than indefinite
10FAQ
Questions we get asked.
Yes. Strataworks is in pilot with geotechnical consultancies in the US, on live site investigations rather than test data. Those firms have asked us not to name them while the work is running, which we expect. On a demo we will walk you through anonymized captures from real projects, and we will put you in touch with a reference as pilots close.
That is what the projects list is for. Footage against plan, active holes, review queue and last activity across every job you carry, on one screen, with end-of-shift summaries written for you. The work that used to scale with each new project was coordination, and that is the part we automate.
Yes, and most firms should. Strataworks pushes validated boreholes into OpenGround Cloud with configurable field mapping, and a sync view shows what is pending, synced or failed. You are adding a capture layer in front of the system you already trust, not migrating off it.
It is an alternative to the way most teams use gINT, which is to capture on paper and key it in afterwards. You can import your .gpj projects and keep exporting to the formats your clients already accept. What changes is where the data is created: at the sample, from a photograph, instead of in a form after the fact.
Everything. Capture, stitching, depth registration, the quality check, logging, review and publishing all run on the device, against a local database. Nothing waits on a server. When the phone finds Wi-Fi the queued work syncs on its own, and the large image files hold until the device is both on Wi-Fi and charging so a field day never costs you a battery.
Two things anchor it. The run length is measured off world-locked AR rails rather than typed from a tape, and the driller's depth blocks are read off the stitched image and used to fit the tray to true downhole depth.
Nothing that ends up in the log. Breaks, intervals and classifications arrive as suggestions in the same rows your team works in, marked with where they came from. They are added alongside what a person logged and never written over it, and an unreviewed suggestion is excluded from reported values like RQD until someone accepts it. A geologist still signs the log.
You do. Your project data is never used to train models. Every query is scoped to your organisation in the database rather than in the interface, every change is audit-logged with who and when, and deleting is recoverable rather than immediate.
An iPhone on iOS 15.1 or later. The capture uses the AR tracking built into every iPhone since the 6s and does not need LiDAR, so a mid-range phone a few years old is fine. The office side runs in any current browser. There is no Android version yet.
One price per team, not per seat and not per borehole, so putting the log in front of the client who paid for it costs nothing extra. The Team plan covers capture, logging, review, project management and exports for a working crew; Enterprise adds OpenGround, AGS4 and GIS integrations, the template builder and single sign-on. We quote the number on the demo call once we know how many crews you run.
One field day of habit. The crew confirms the interval, sets three points and sweeps, which is faster than writing the card they are replacing. The office side needs no change at all on day one, because the exports and the OpenGround push land in the same places your data already goes.
Book a demo and we will run it on your own project data. No slide deck, just the tool working with your own samples.
Where this goes.
Logging is the first honest capture point in site investigation, and it is still often done on paper. Once the record starts as data instead of a description, everything downstream changes. The ground model builds from logs rather than a re-typed database, and the subsurface becomes something a project queries rather than something it reconstructs. From there the same record orchestrates the investigation around it: the crews, the rigs, the documents and the reporting. We started at the log because that is where geological data is born.
See it for yourself.
Half an hour, the tool running live, and your samples rather than ours.
- Your own project data, not a canned demo set
- The capture flow running end to end on real samples
- Pricing and what switching actually involves
- Answers from the engineers who built it
Prefer email? contact@strataworks.app