AI-native site investigation for geotechnical teams.
Built for field conditions, not conference rooms.
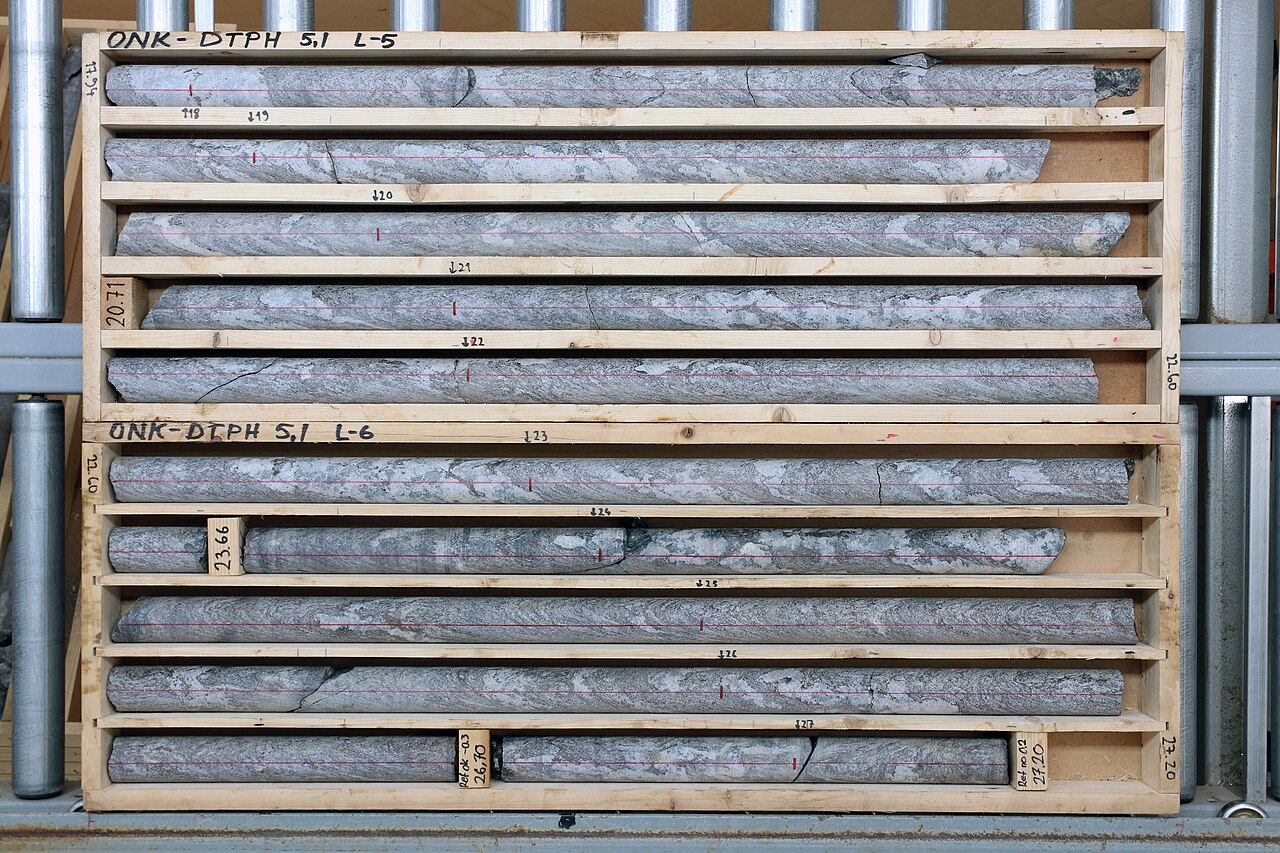
Every tray photographed, measured and logged where it comes out of the hole. Every borehole on the project map as it is drilled. Every interval already a layer in the ground model. Your client watches the investigation happen instead of waiting for the report.
01Capture
Three taps, then sweep.
Confirm the tray interval, then set three points in AR. The rails lock to the world, and the second point is the end of the run, so the length is measured rather than read off a tape and typed in.
The phone streams pose-stamped frames as you sweep, with exposure locked at the first row so the tray does not shift tone halfway down. Cross the end gate and the row closes itself.
Stitching runs on the device while you carry on working. The frames become one continuous image of the tray, not a folder of overlapping photographs somebody has to sort out later.

02Depth and drafting
Pinned to real depth, with the first pass already done.
The driller's depth blocks are read off the stitched image and used to anchor the tray to true downhole depth. Declare whether the blocks are in metres or feet once per borehole and it stays declared.
Natural breaks are detected and intervals proposed, so RQD, total core recovery and fracture frequency come out of the image rather than out of a tape and a clipboard. Conventions follow ASTM D6032.
Everything is stored in metres and converted where it is displayed, so a project set to feet and a project set to metres are the same numbers underneath.
03Logging
Log on the core, not on a form.
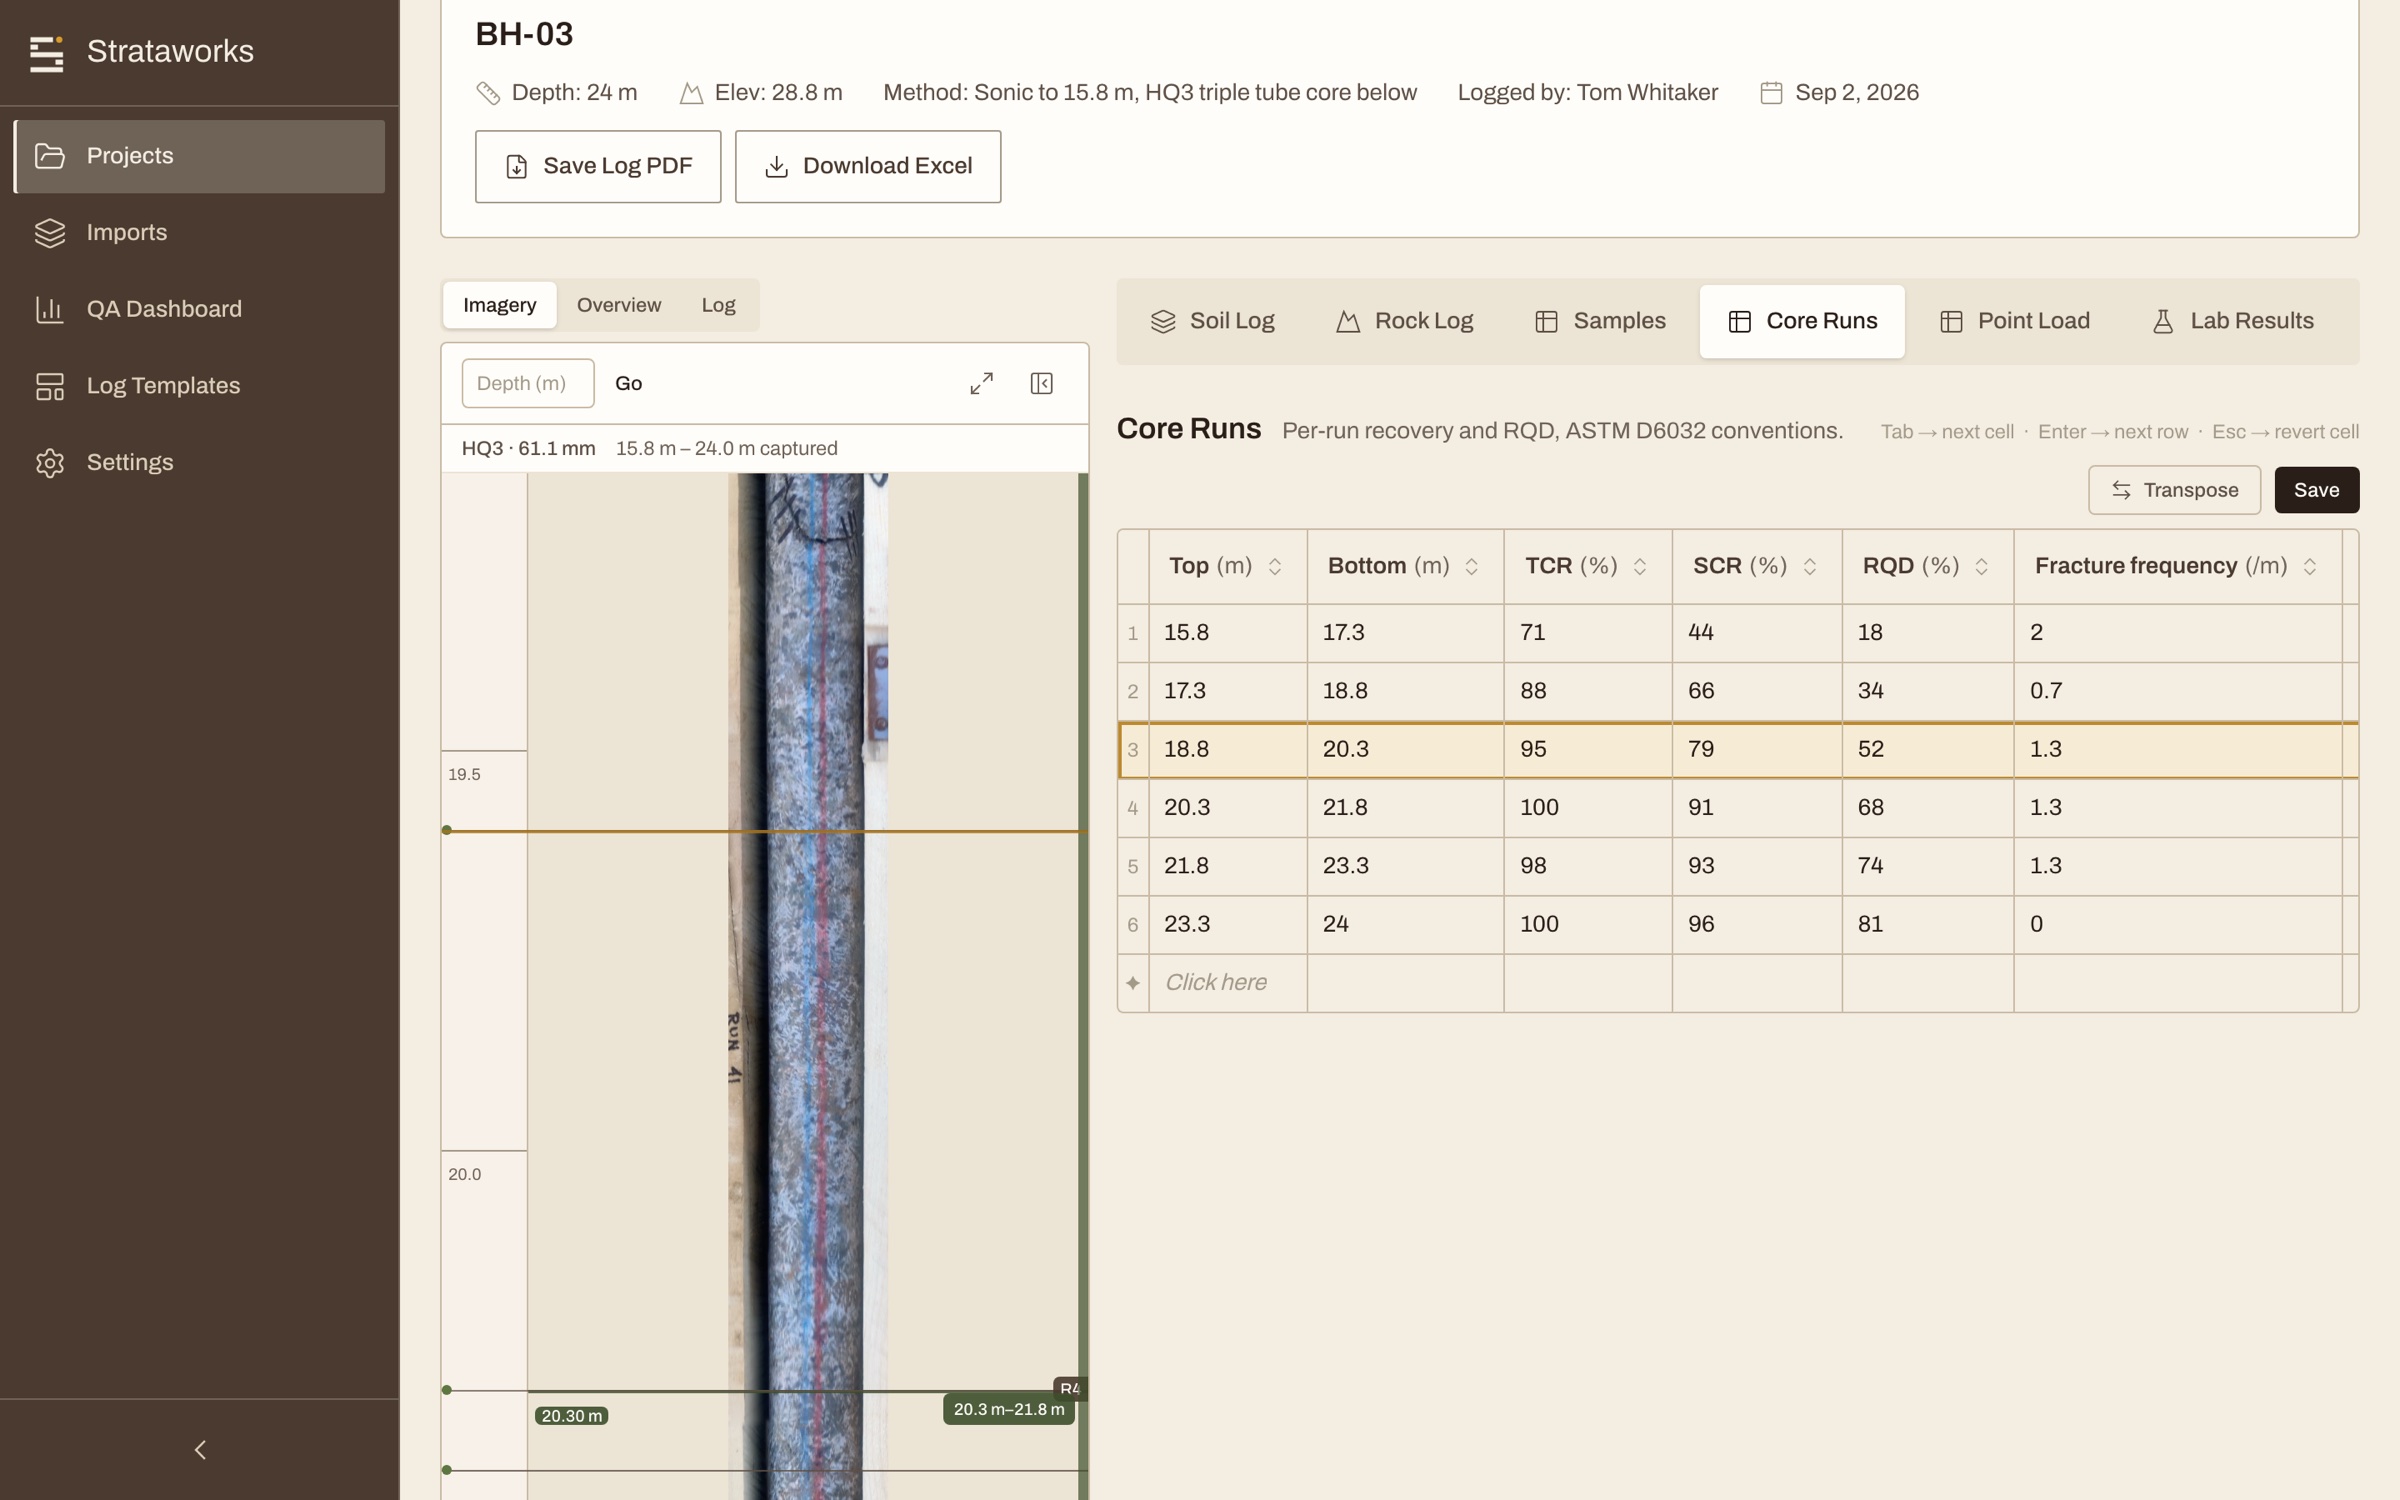
Geology, discontinuities and runs are tapped straight onto the image at the depth they occur. The strip and the grid scroll on the same axis, so a row in the table and a place on the core are the same thing.
Suggestions arrive as rows in the layers your team already works in, marked with where they came from. Accept, edit or reject. Nothing is written over what a person logged, and an unreviewed suggestion is left out of reported values until somebody accepts it.
The quality check runs the moment stitching finishes, while the tray is still in front of you and a rescan costs nothing. It catches a weak section, and it catches a multi-row tray assembled in the wrong order, which is the failure that otherwise looks fine and is not.
04The office
Everyone else sees it the same day.
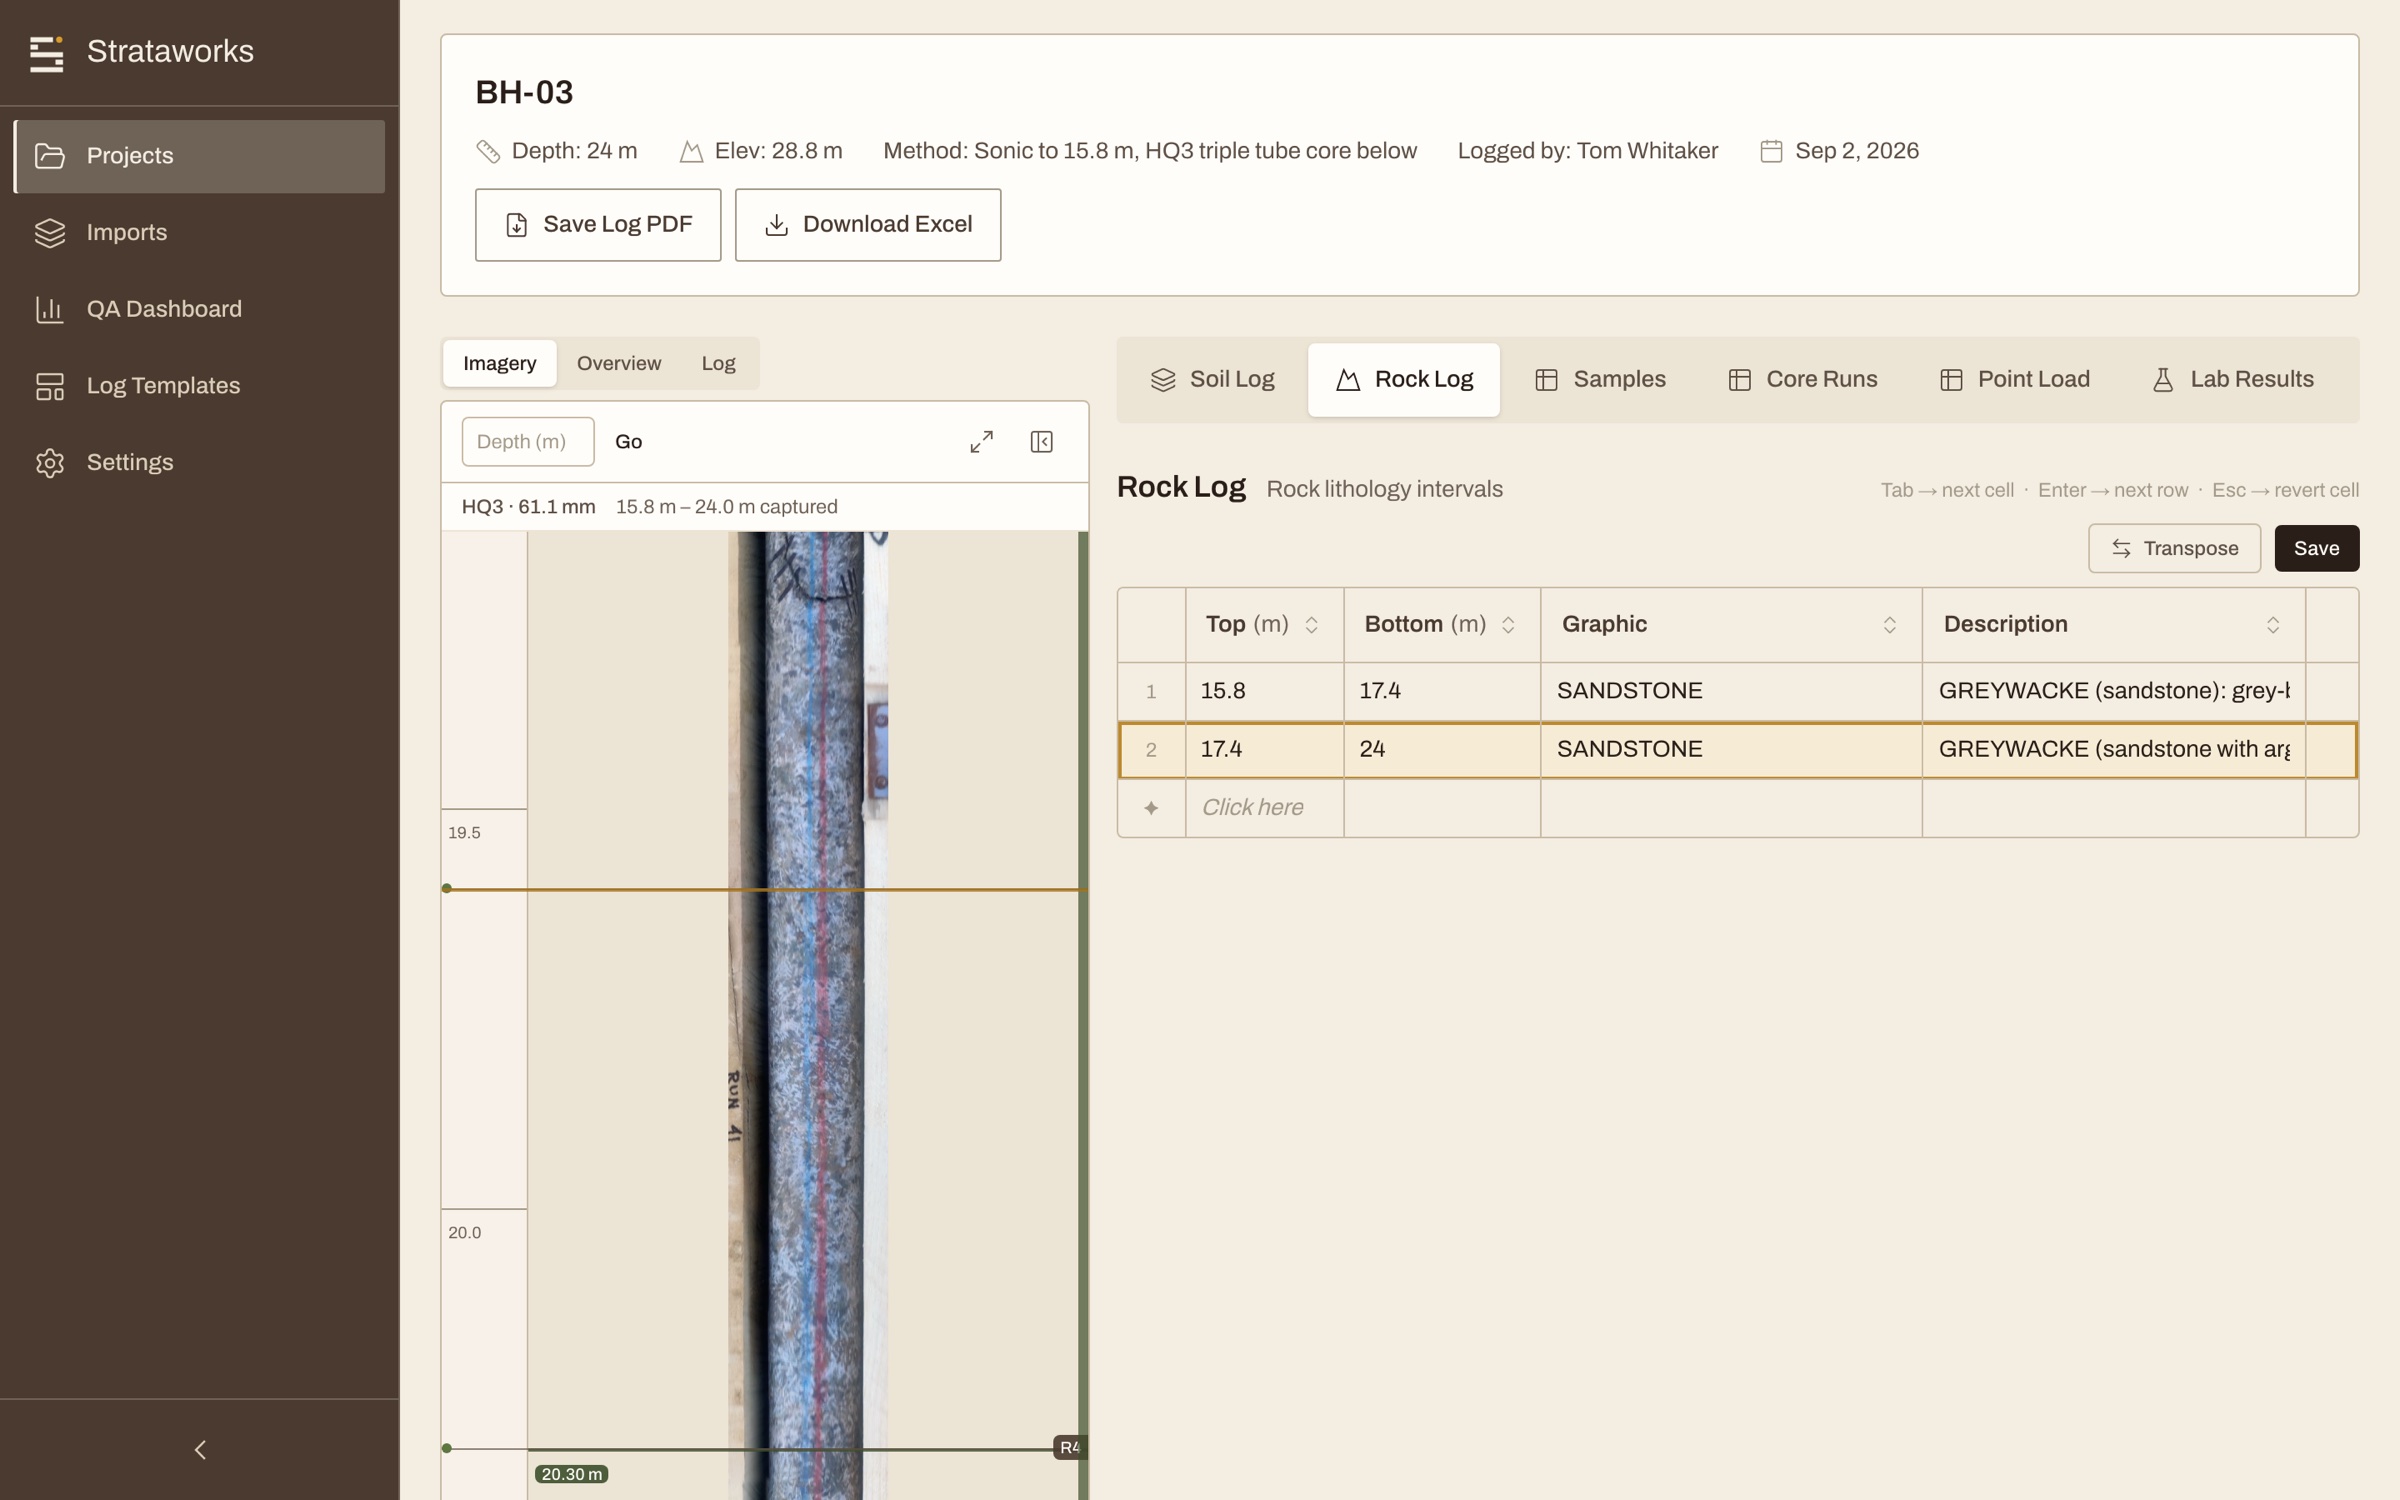
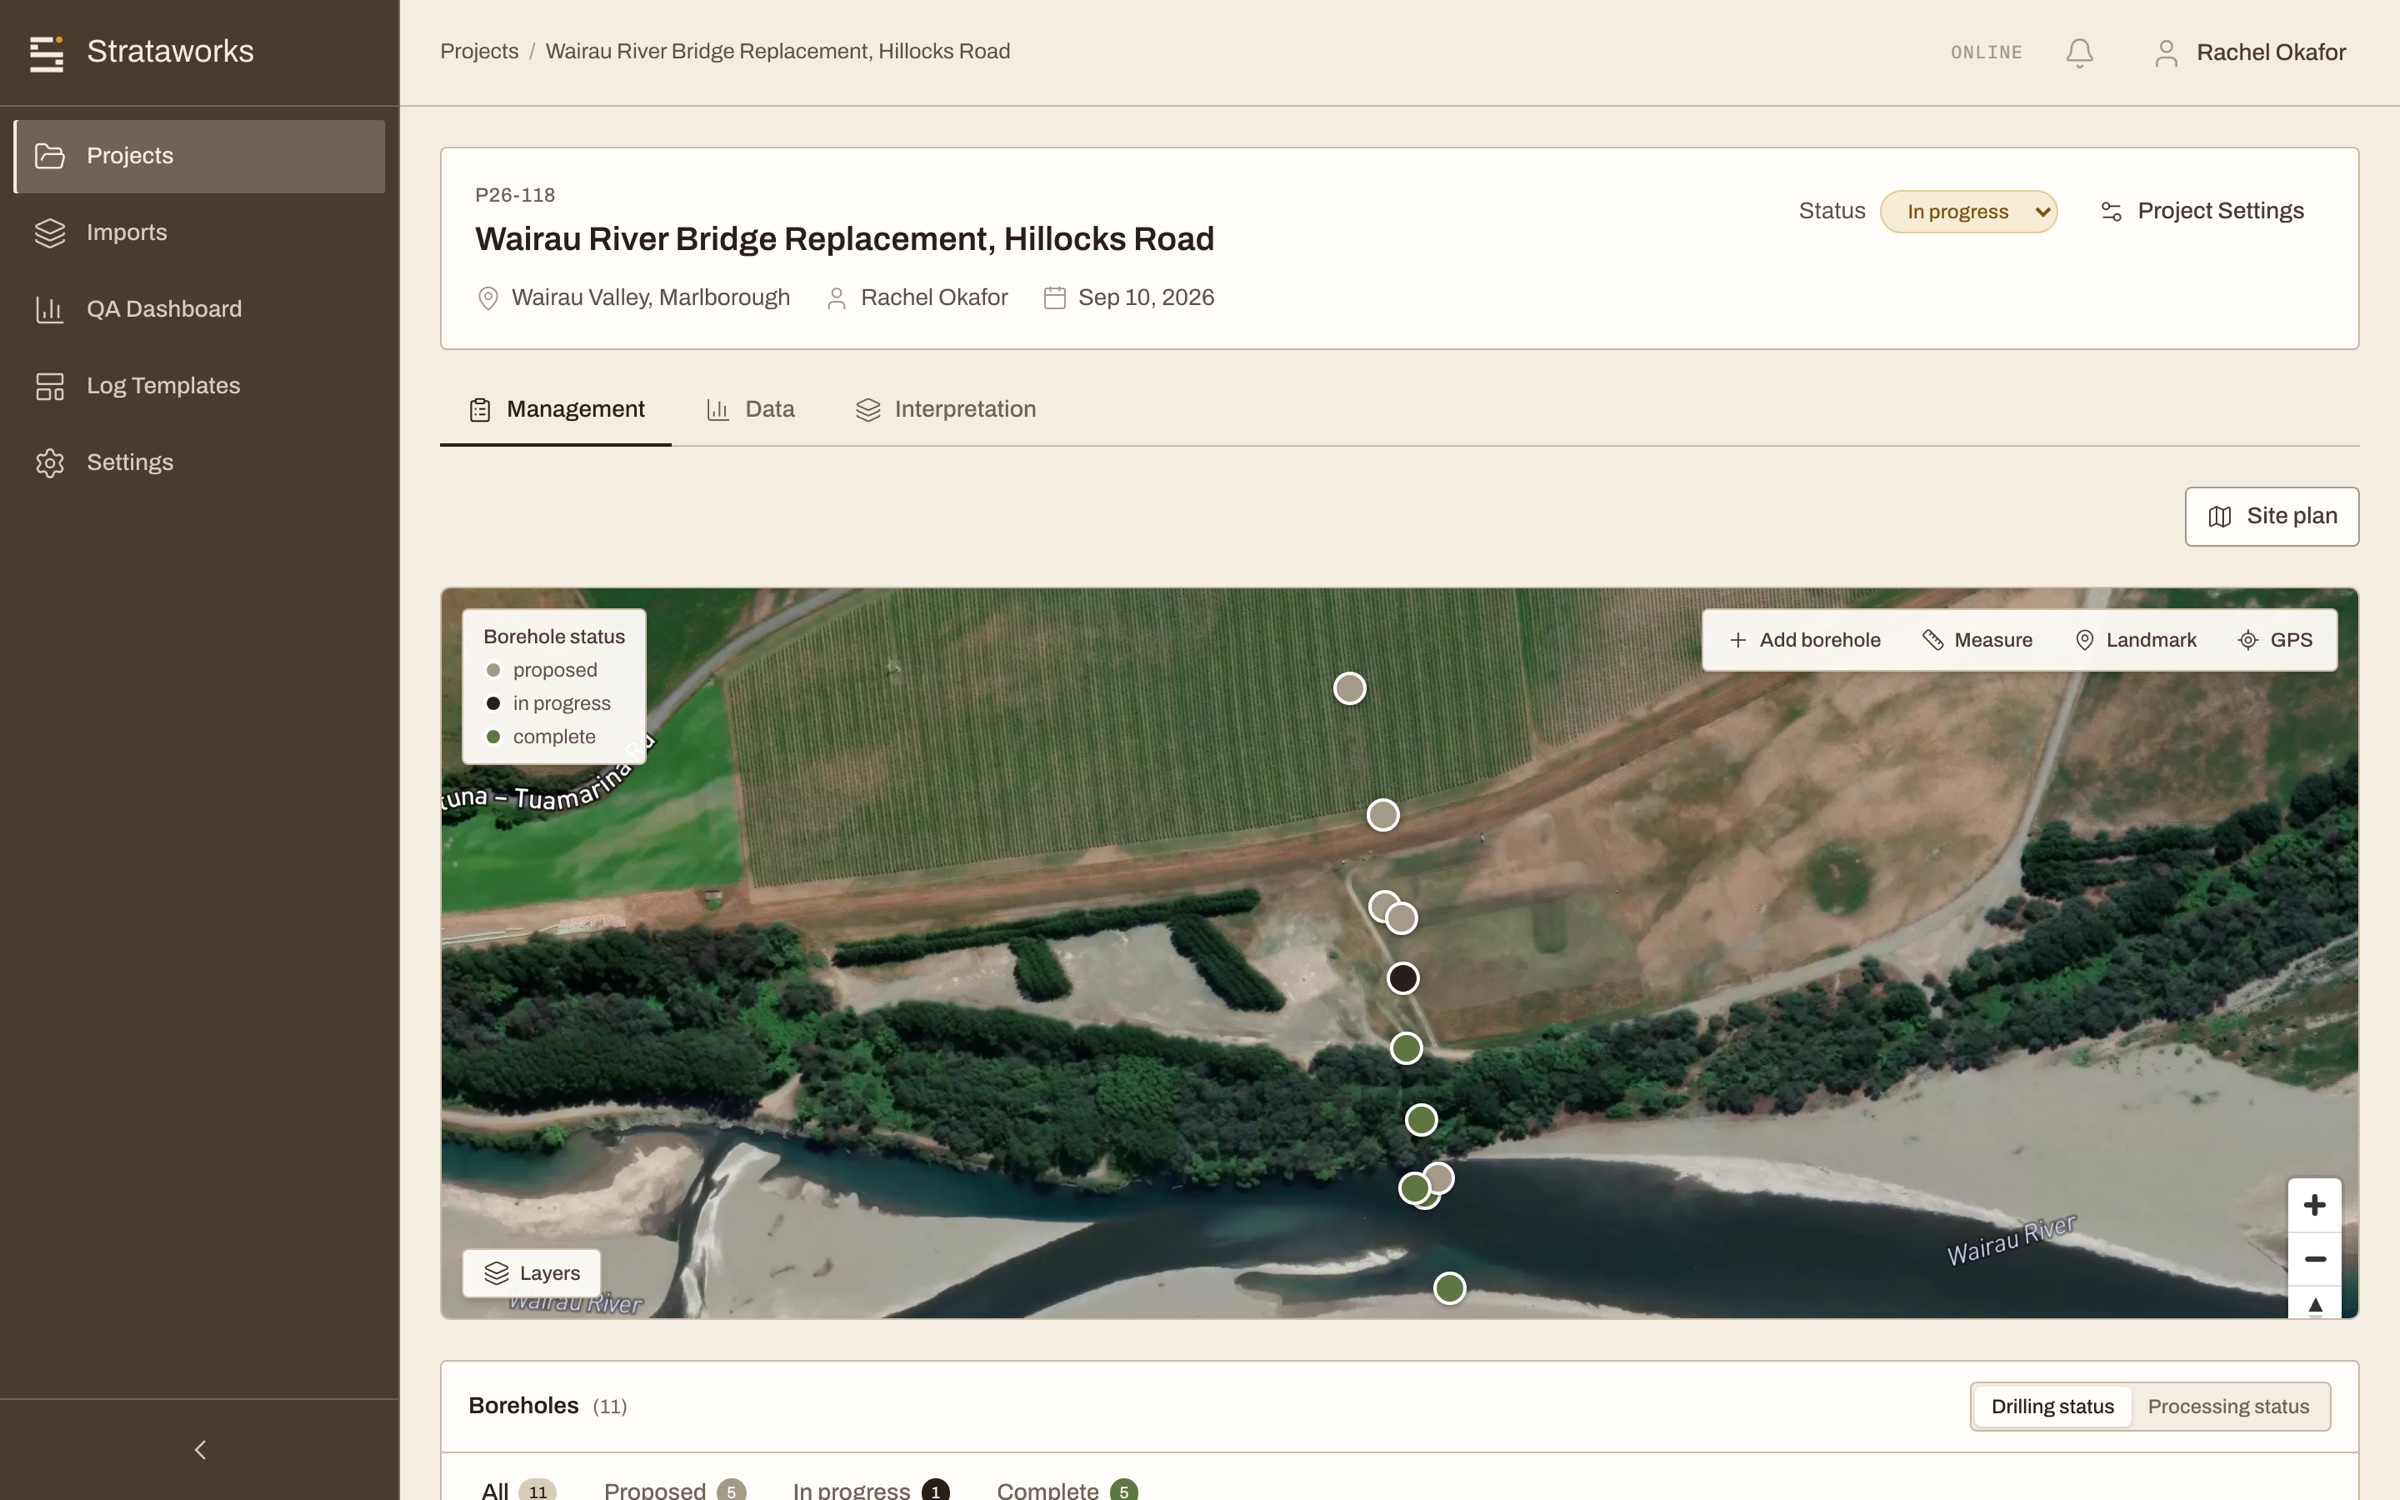
The strip the field logged is docked beside the data grids in the browser. Collars land on the site map as they are drilled. The schedule shows footage planned against footage actually turned, and the daily site diary is written on site rather than reconstructed on Friday.
Reviewers work in the same record: row-level comments, review status per borehole, bulk actions, and a complete audit trail of who changed what and when.
Download a project to a phone and it brings the other devices' scans with it, so anyone can open any borehole in a canyon with no service and still see what the rest of the crew captured.
05Interpretation
The ground model, from the logs you already have.
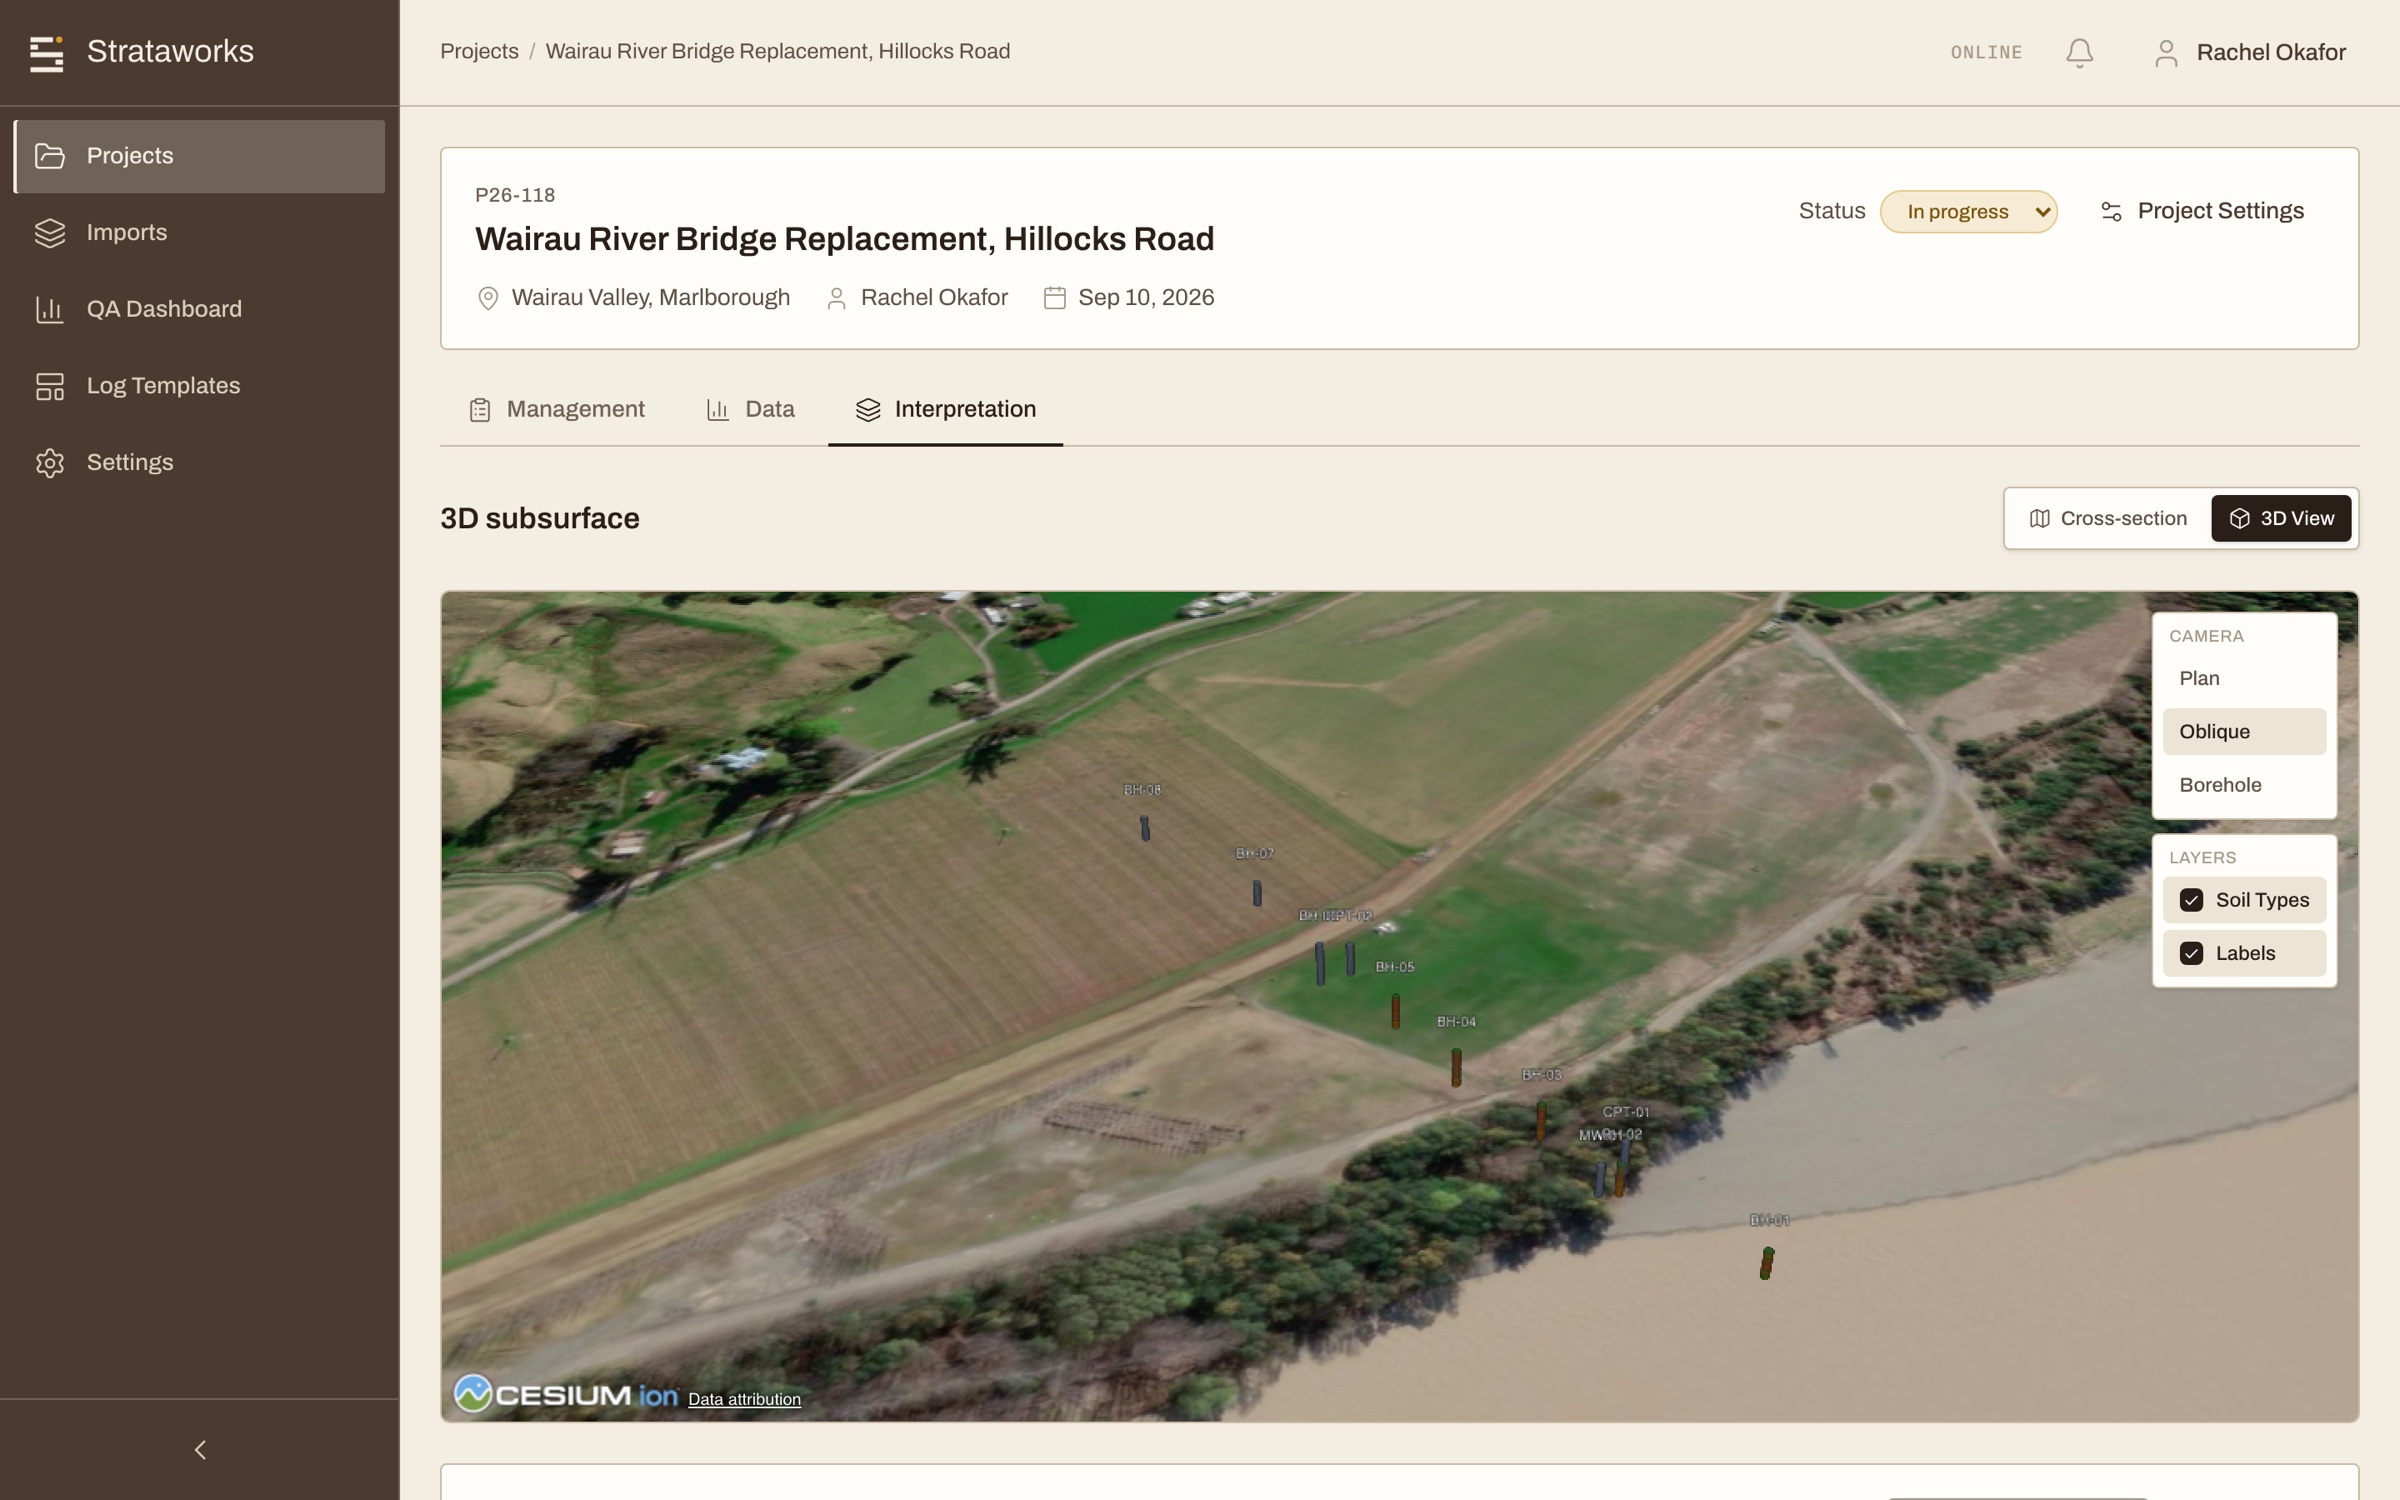
Every logged interval is a coloured band on a borehole in 3D, under the terrain and the satellite imagery, at the site's real coordinates and elevations. Plan, oblique and borehole camera presets frame the holes, not an empty field.
Draw a section line across the holes and the same intervals become a cross-section, with formation tops to correlate between boreholes and annotations for the designer. Sections are saved with the project.
The model is only ever as current as the logs, which is the point: the day a hole finishes, it is in the section.
06Review
Reconciliation that does not wait for the deadline.
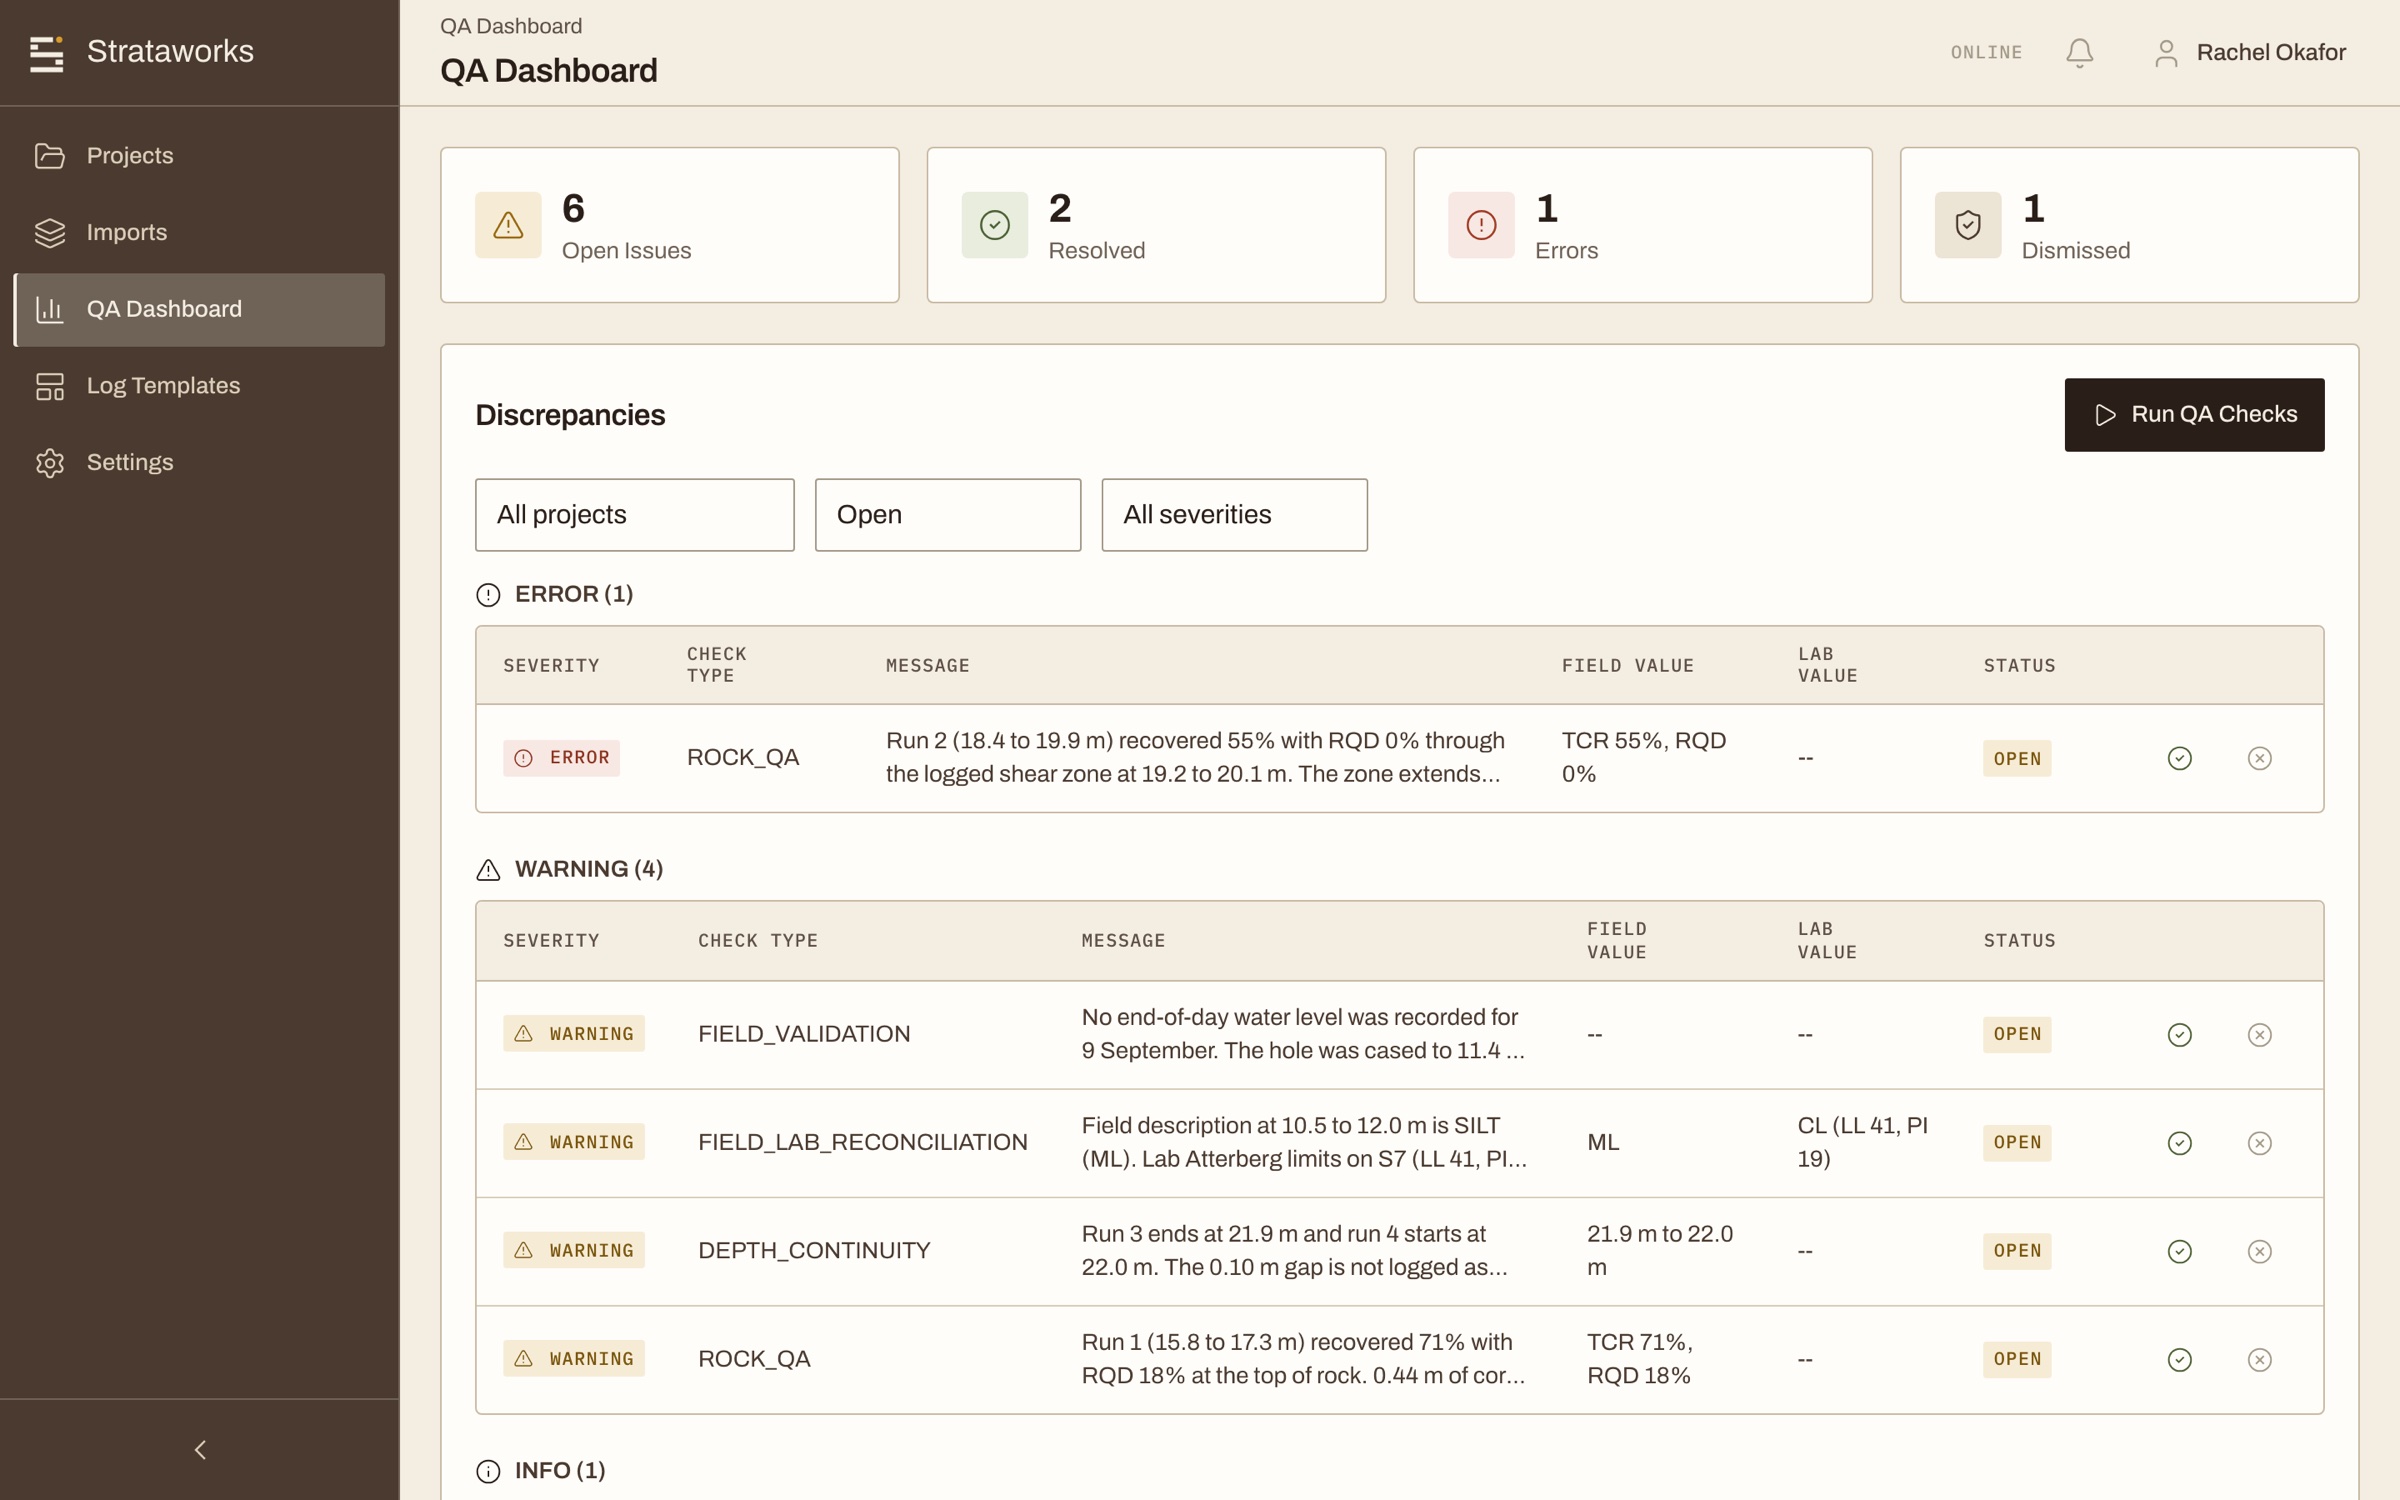
Field descriptions under ASTM D2488 are reconciled against lab results under D2487 as the lab data arrives, with the disagreements listed by depth rather than discovered in a spreadsheet.
Depth gaps and overlaps, sample numbering, SPT blow counts against described density, RQD against fracture frequency, and USCS symbols against the plasticity and grain size in the same description.
Findings route to one dashboard with severity, filters, assignment and resolution tracking. Nothing resolves itself.
07Your log, your template
The log looks like yours, not ours.
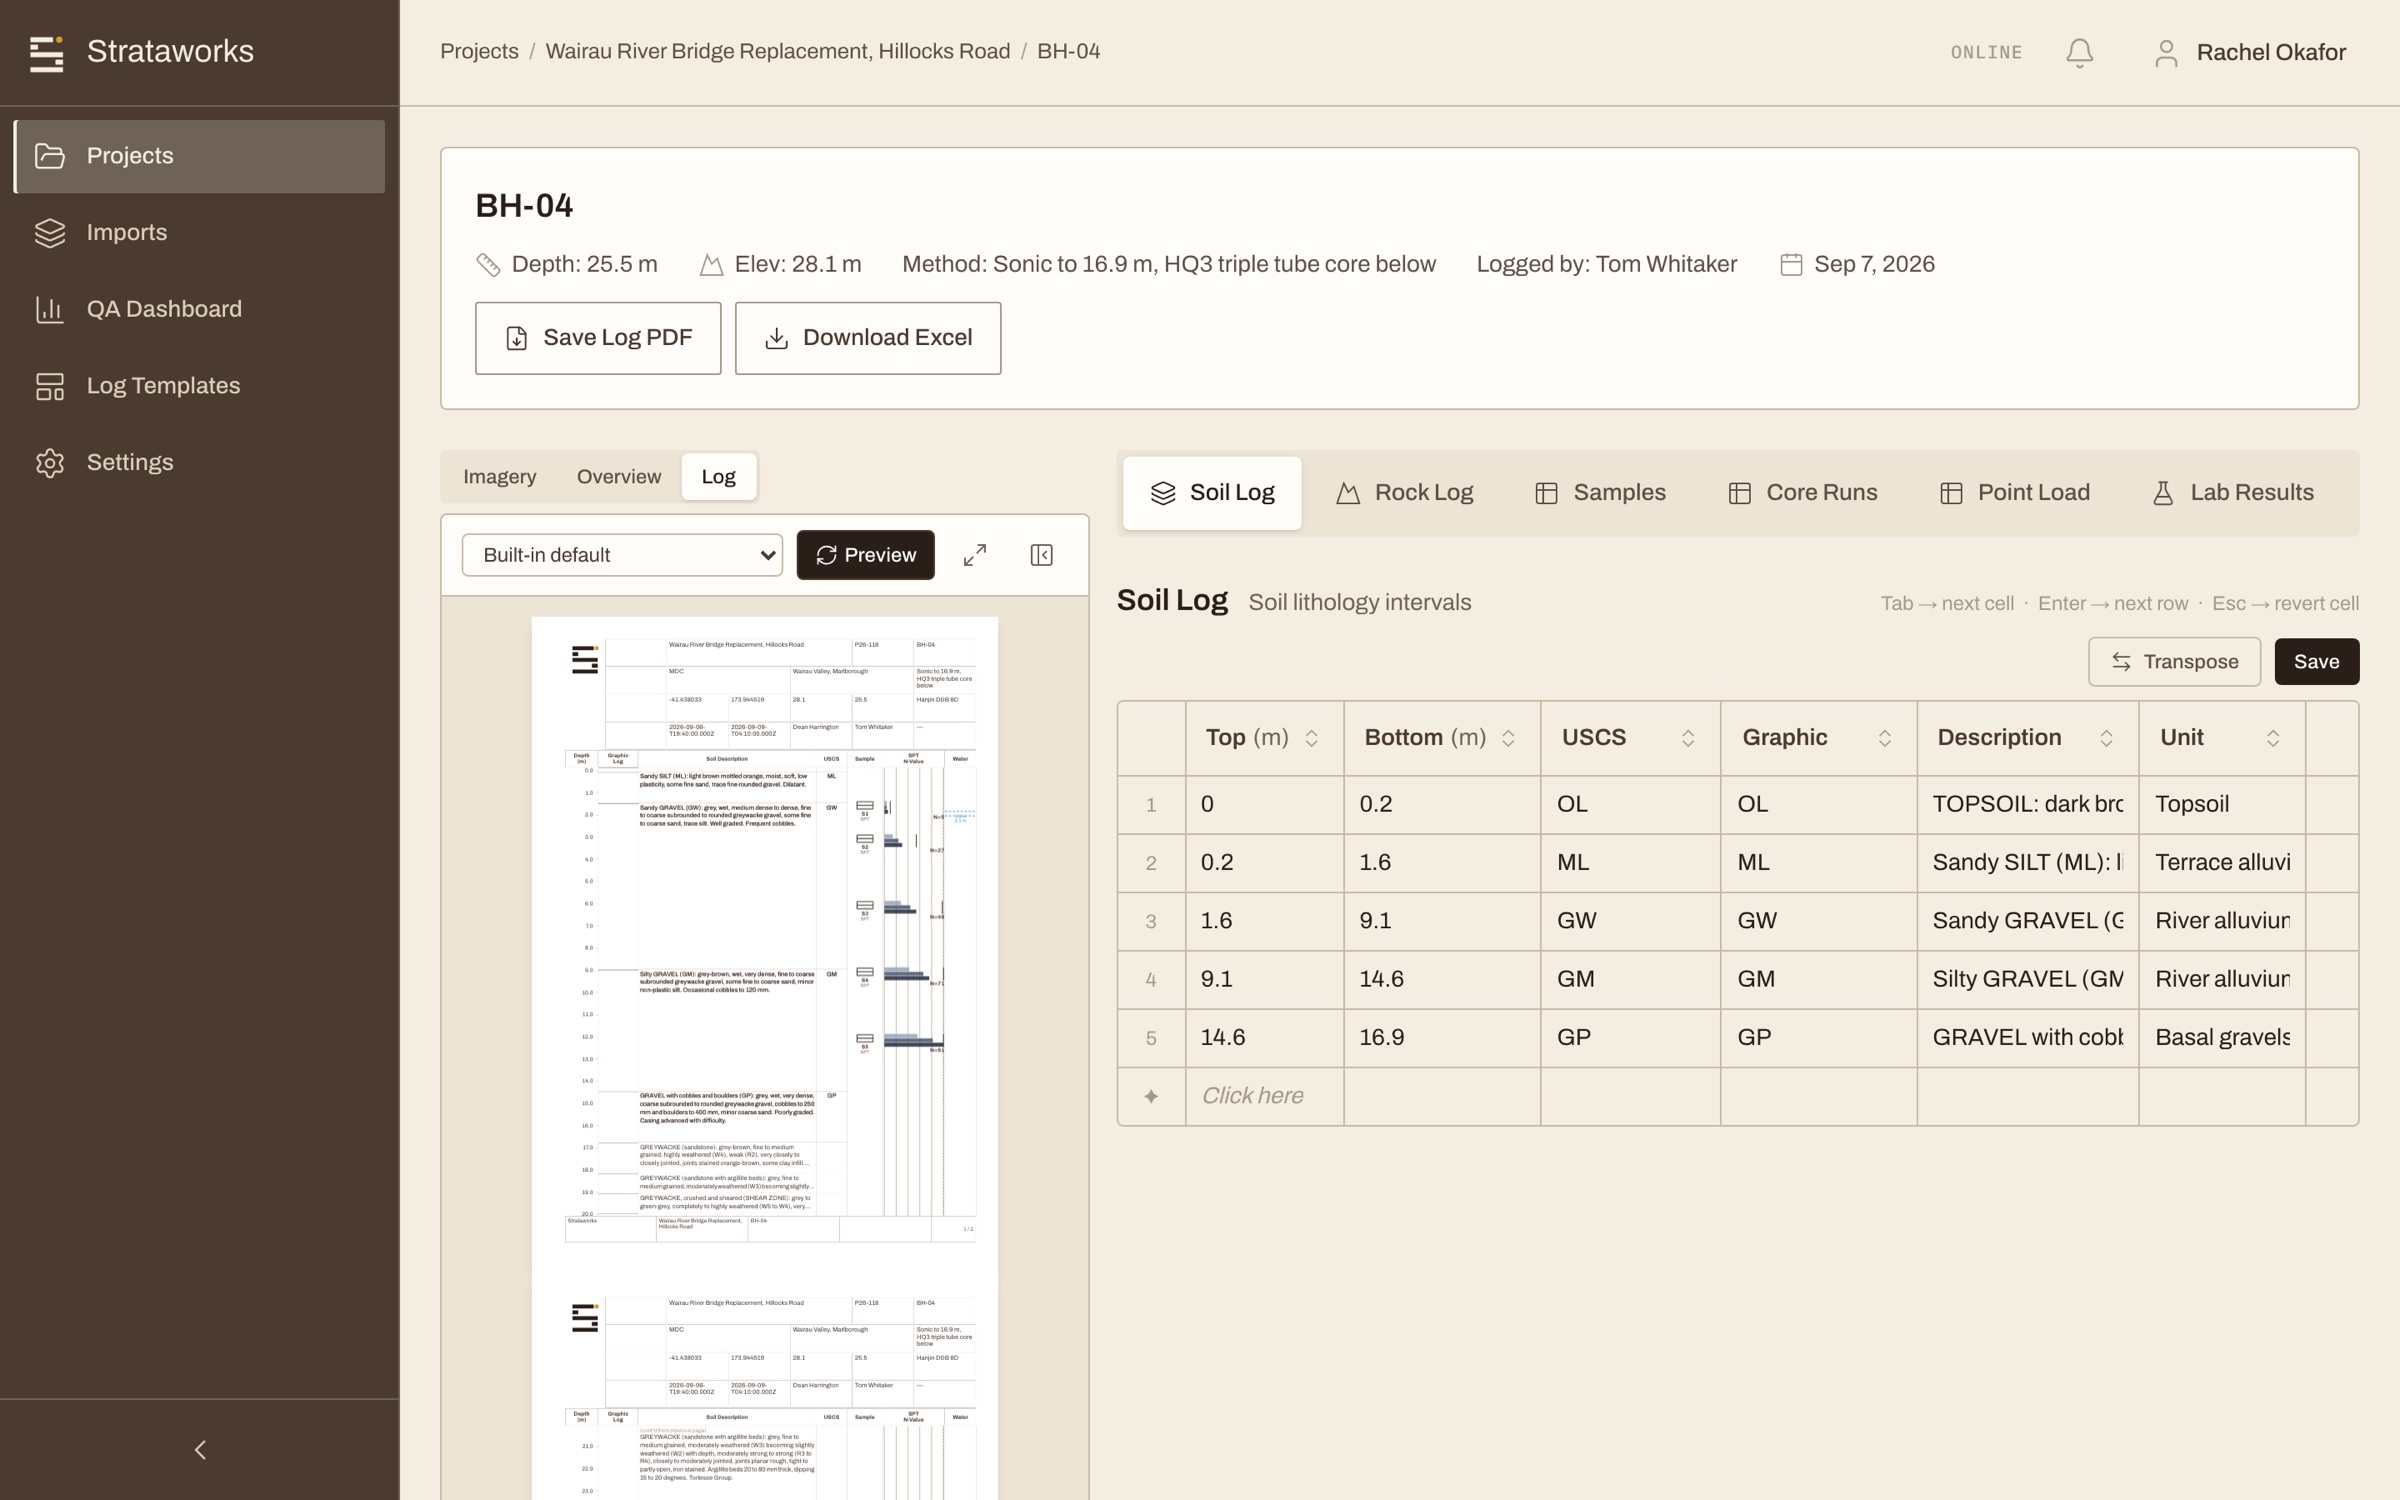
Build the log template once, with your columns, your header block and your conventions, and every borehole renders to it. The preview sits in the workspace beside the data, so a reviewer sees the page the client will see.
AGS 4.1 defaults come with the account for firms that report to that standard, and a project can carry its own template when a client wants something different.
08In and out
It fits the systems you already run.
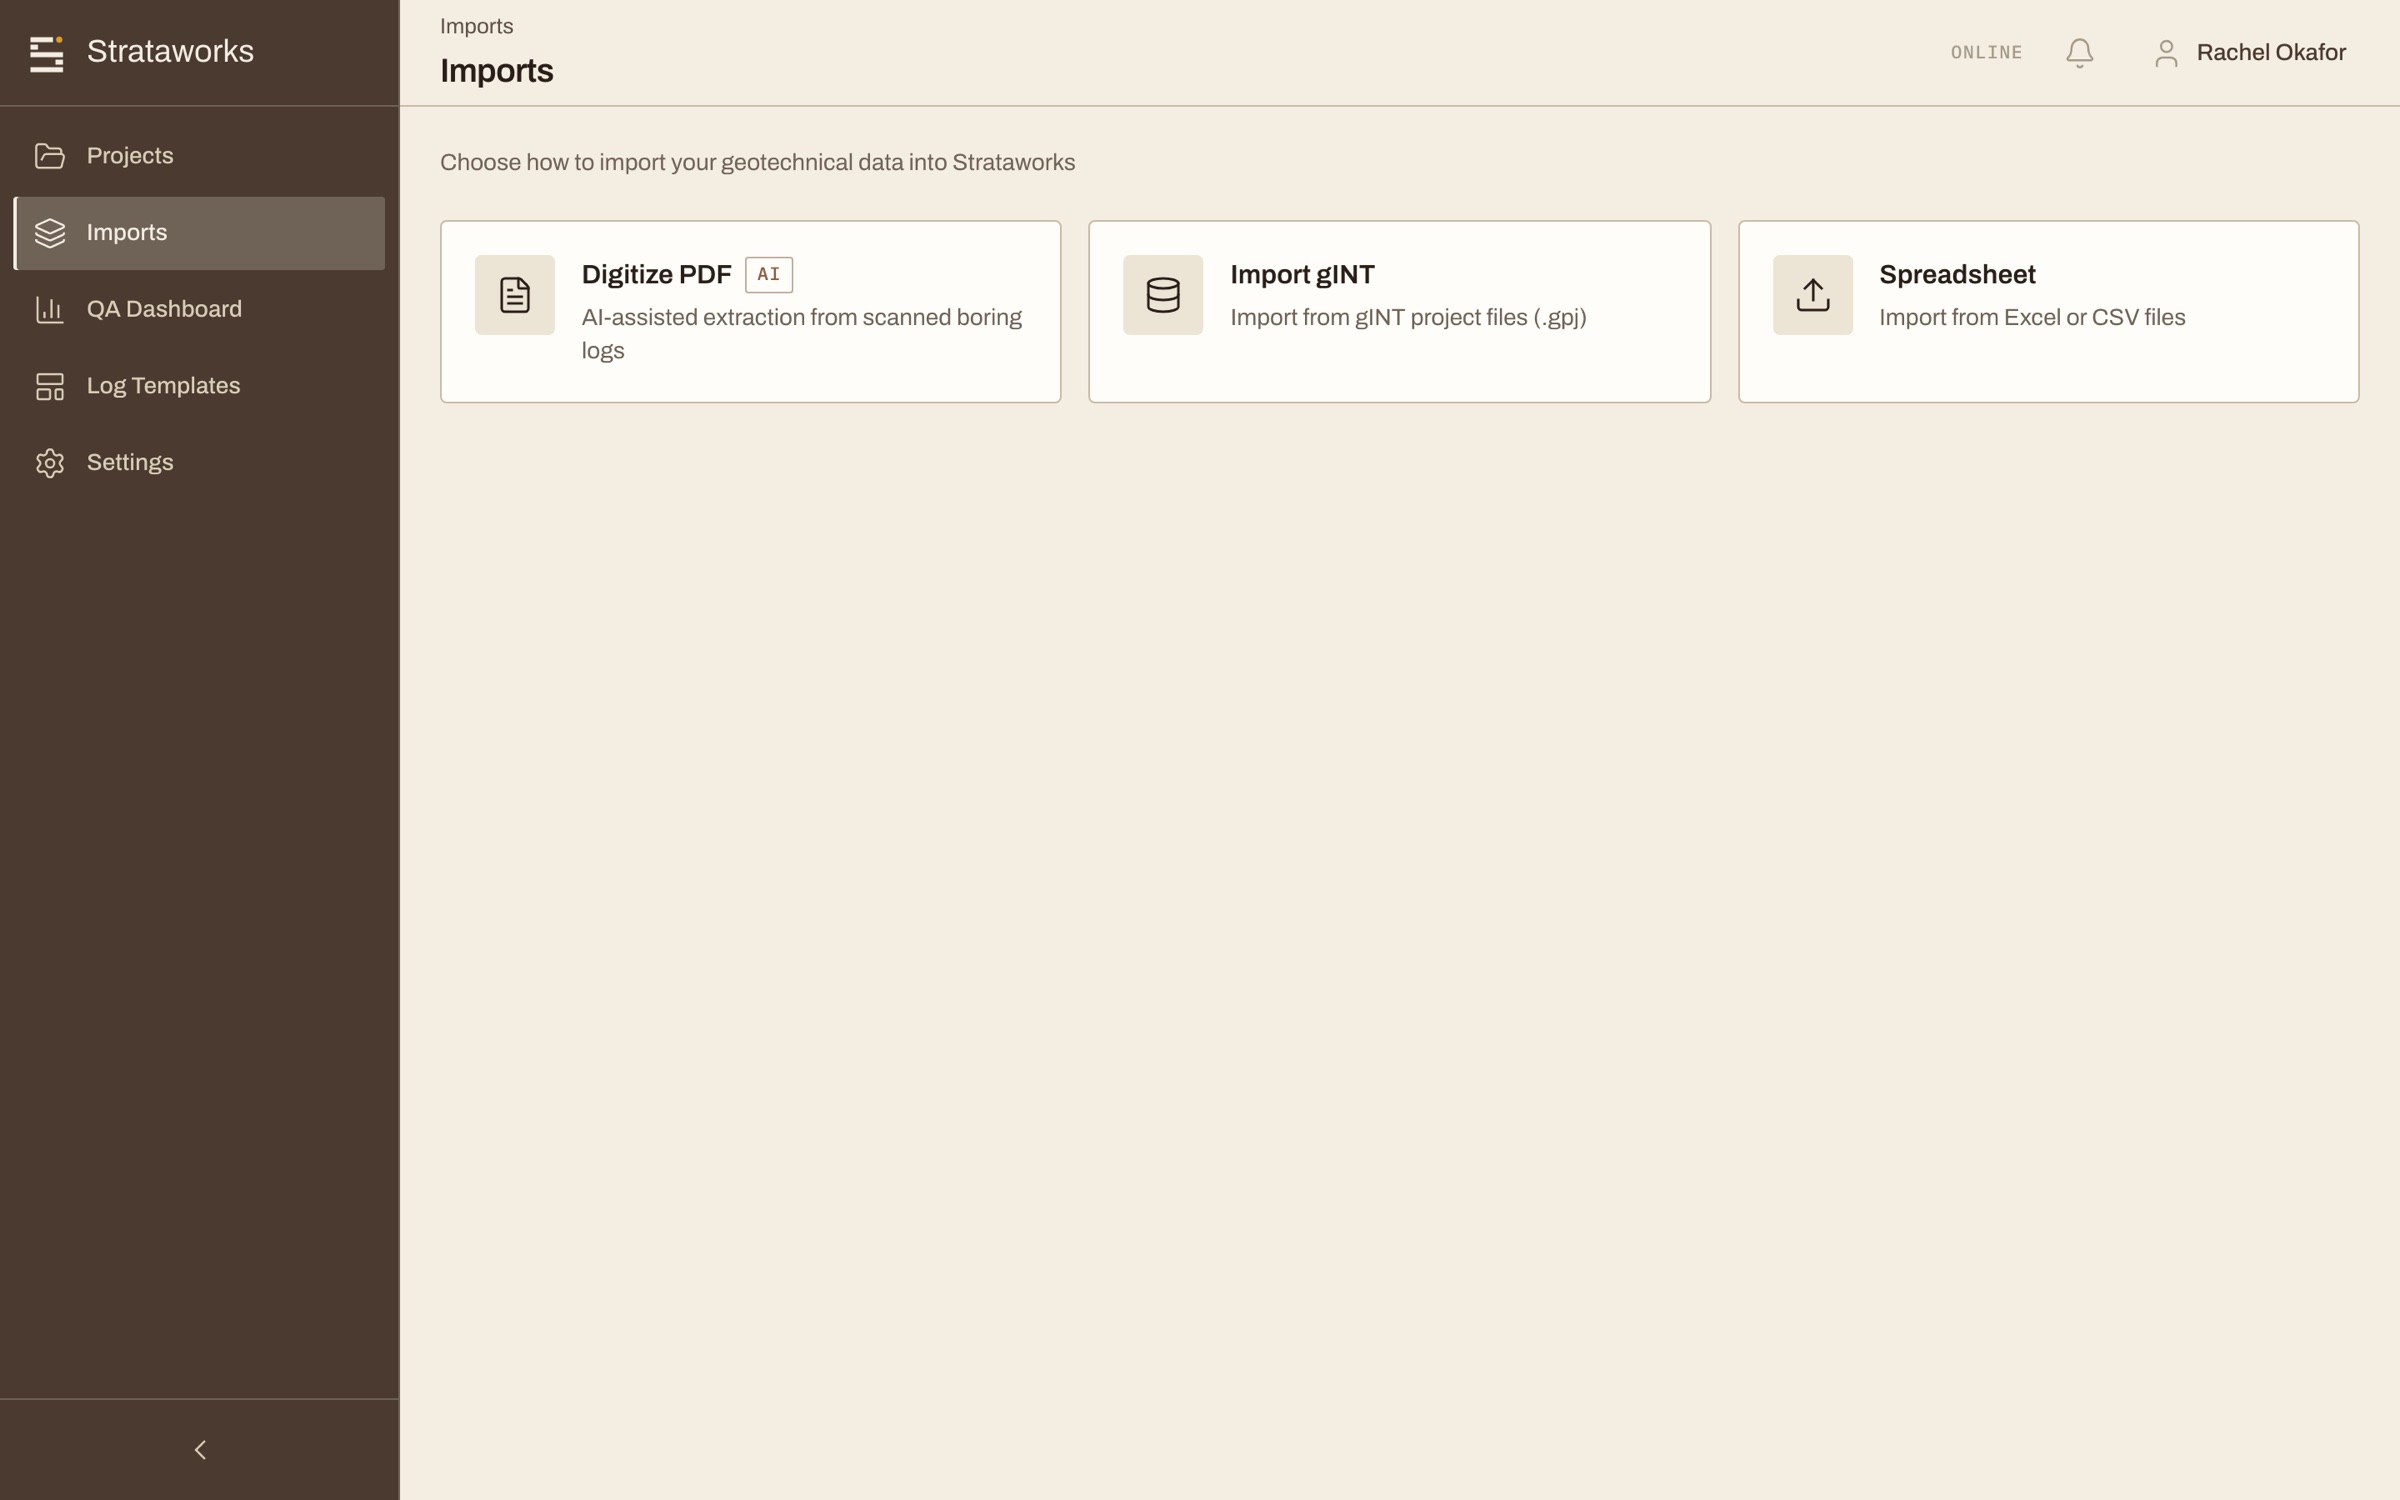
Bring in gINT .gpj projects, spreadsheets through a column-mapping step, and scanned PDF borings read by the digitiser with a confidence score on every field. Everything lands in a review queue first.
Send out your own log template rendered to PDF, AGS4 for the client, XLSX with a sheet per table per borehole, and DXF, KML, GeoJSON or Leapfrog CSV for whoever is building the model. You choose the coordinate system and everything projects to it.
If OpenGround Cloud is your database of record it stays your database of record. Validated boreholes push across with configurable field mapping, and a sync view shows what is pending, synced or failed.
Want to see this with your own core?
We will set up a live walkthrough. No slides, just the tool running with real data.